2021
Observing Geometry for the 2021 Apparition
The plots presented here are for general planning purposes. If you need more detailed values for the different geometric conditions, use the JPL Horizons routines to compute the values for your specific situation.
Geometry was computed using the orbital solution JPL#199.
Geometry Data File
The geometric data plotted below is included in ASCII format in this Data File.
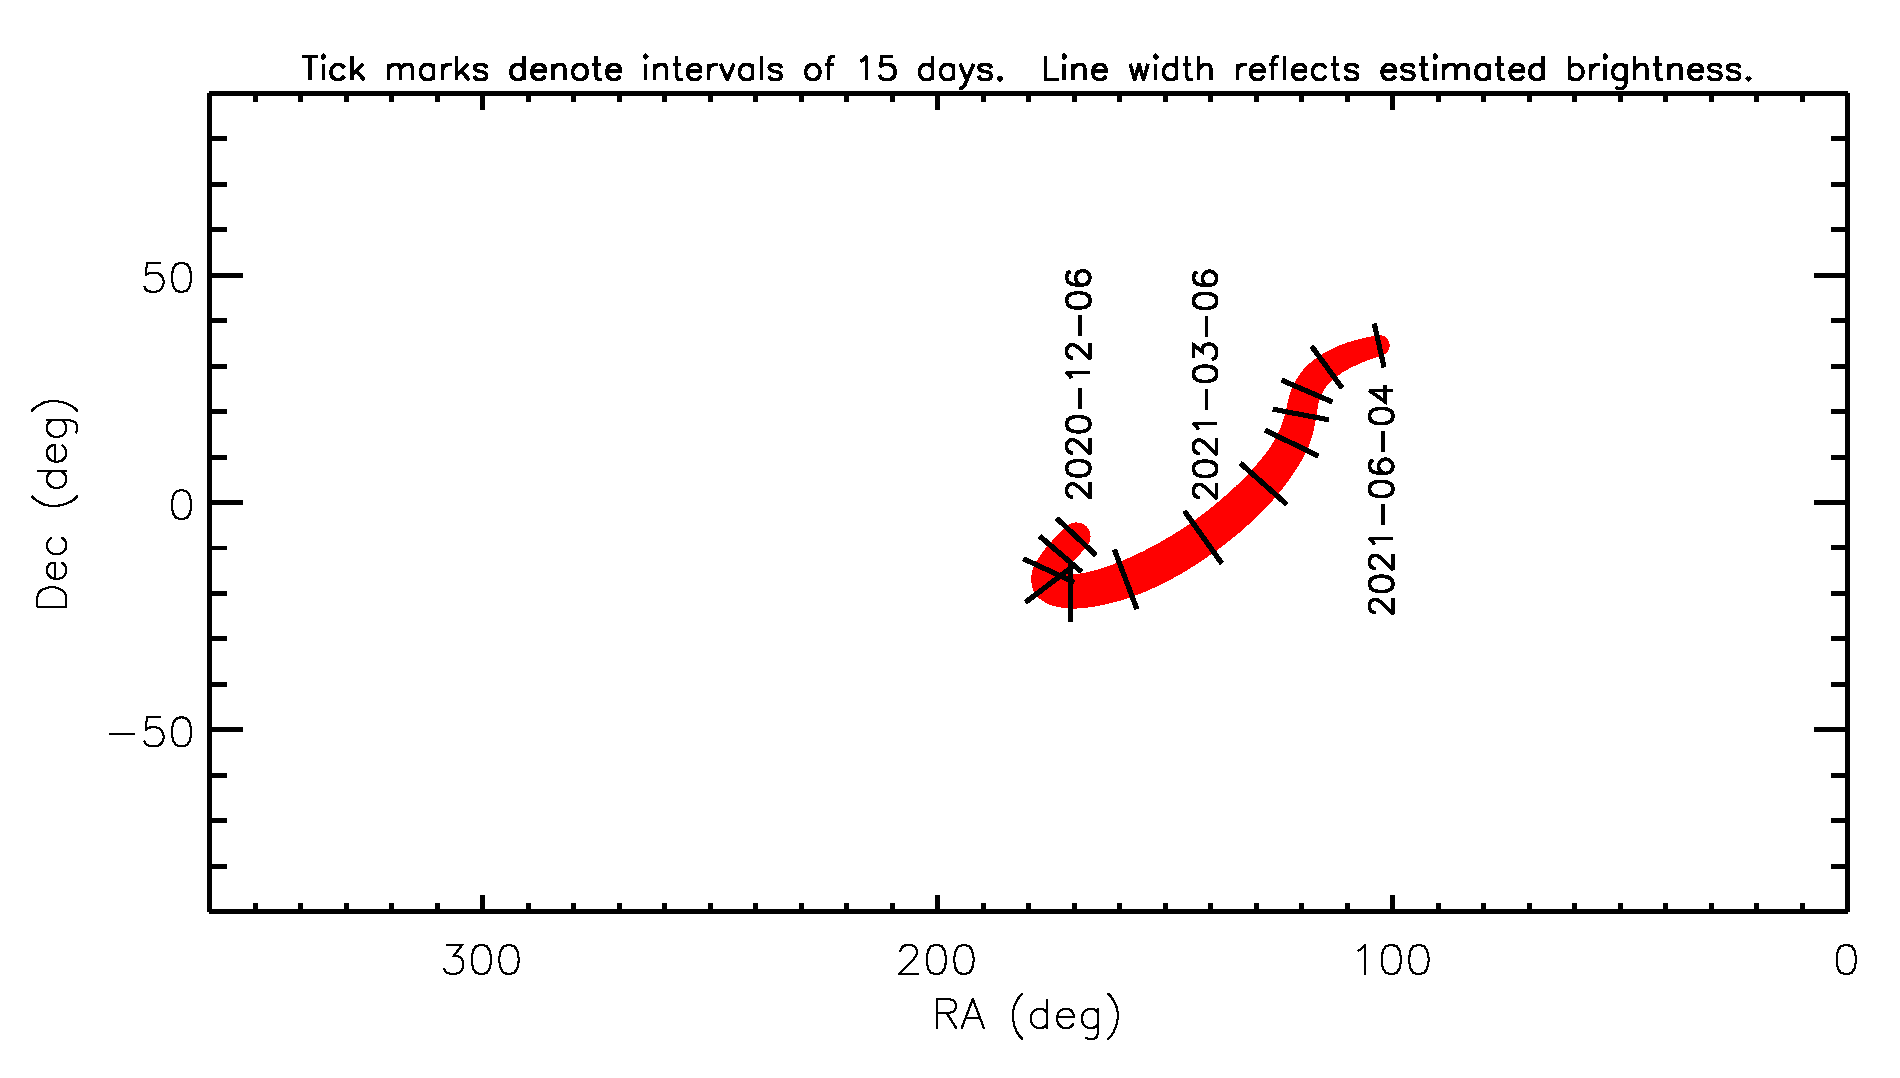
Right Ascension and Declination
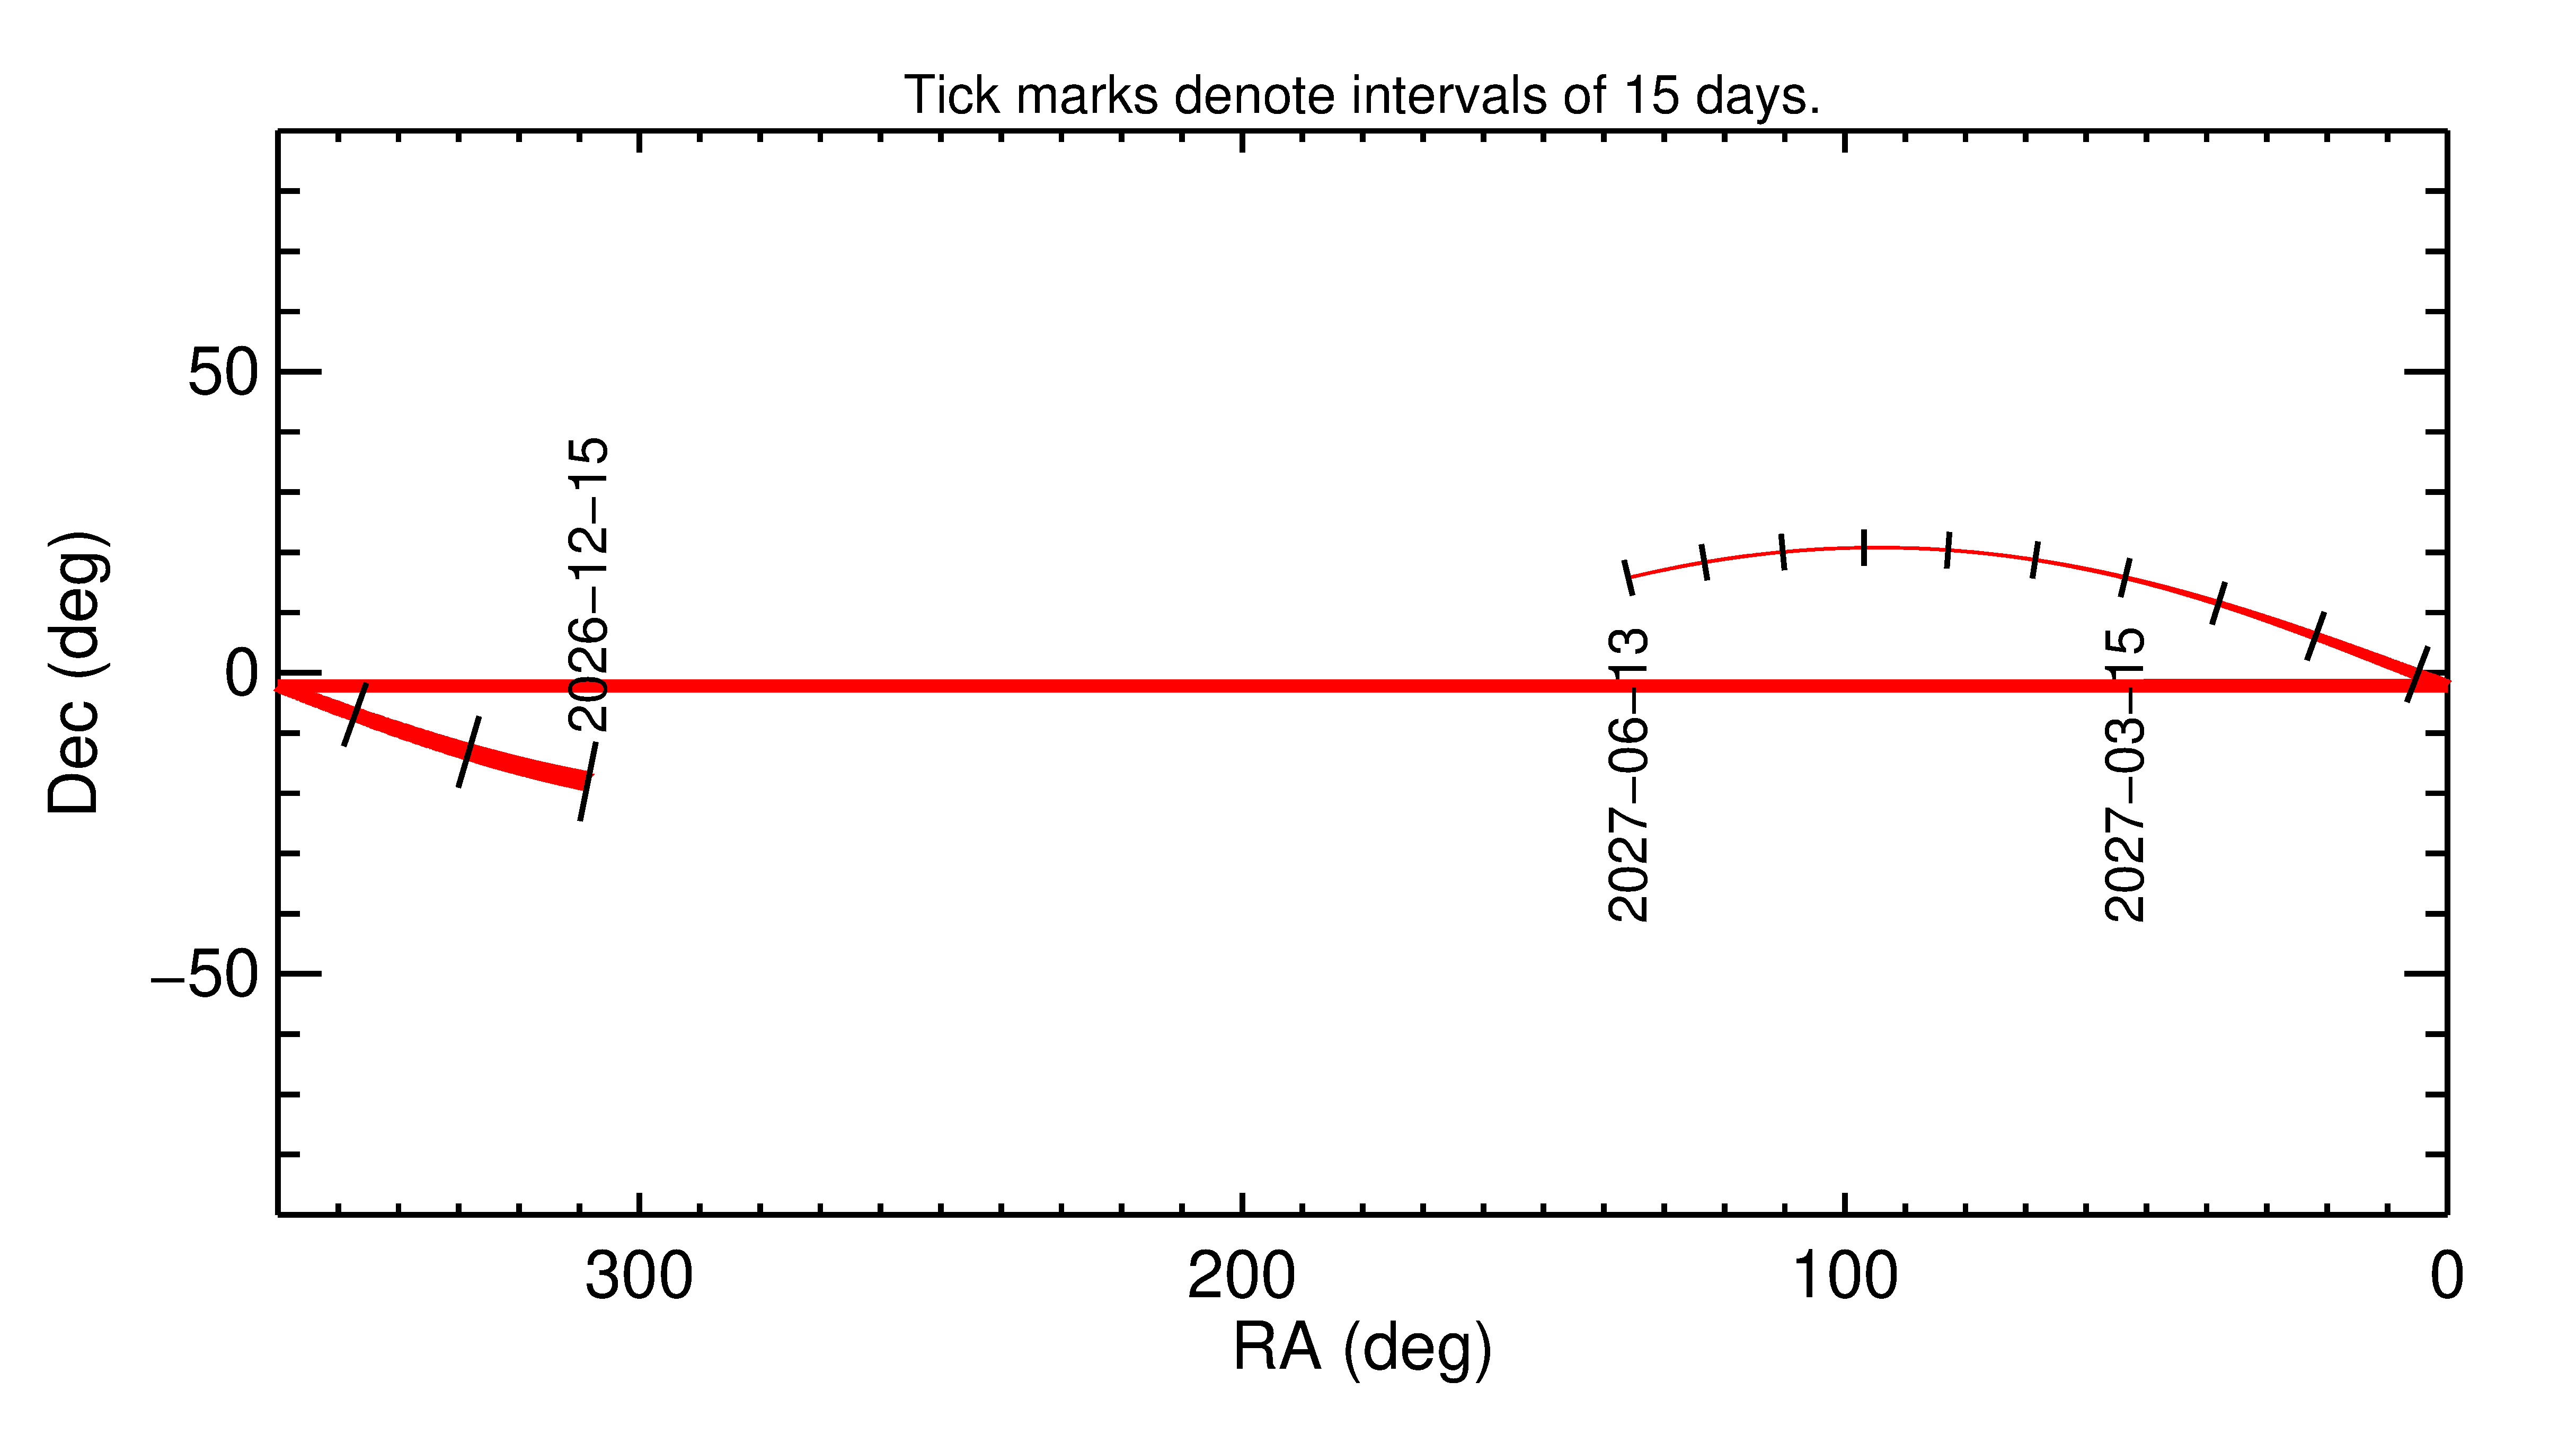
Note that the width of the line reflects the objects estimated brightness, which is plotted below.
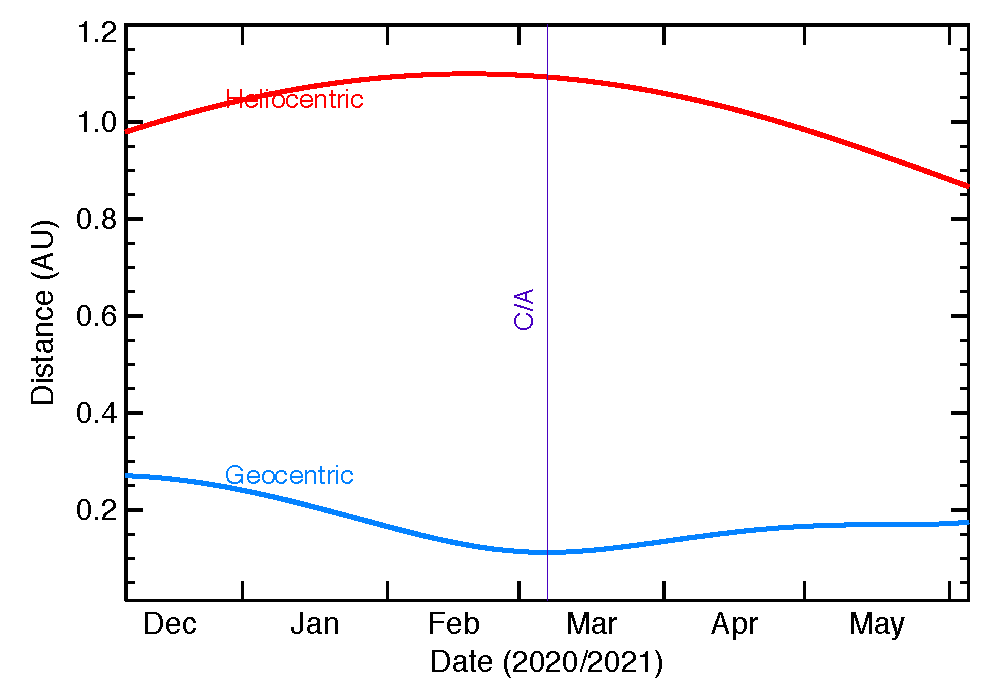
Heliocentric and Geocentric Distances
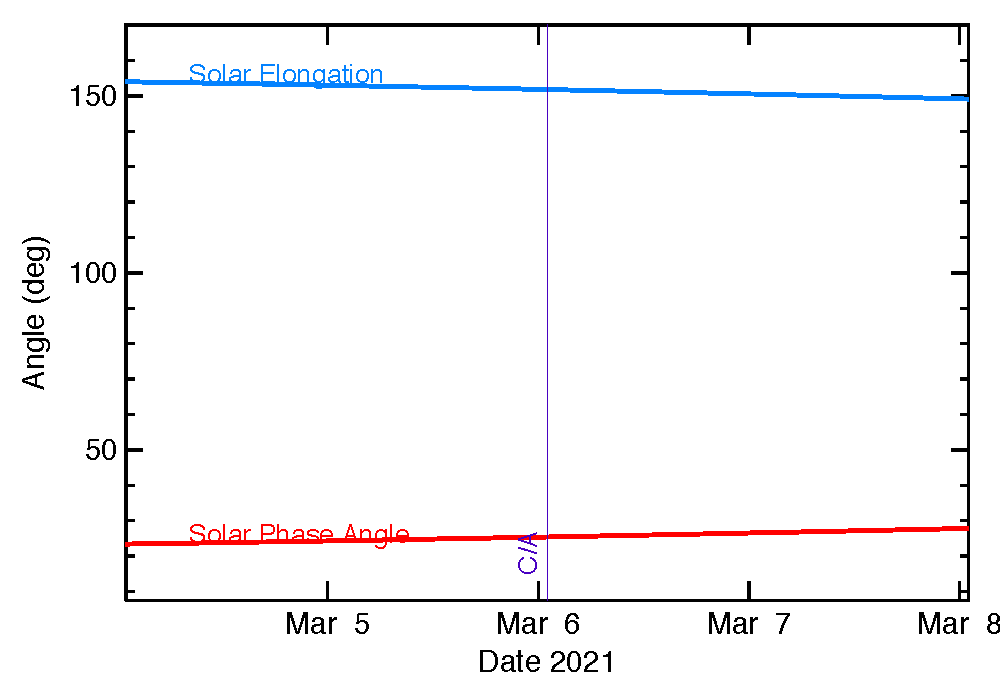
Solar Elongation and Solar Phase Angle
Expanded view of the angles around close approach: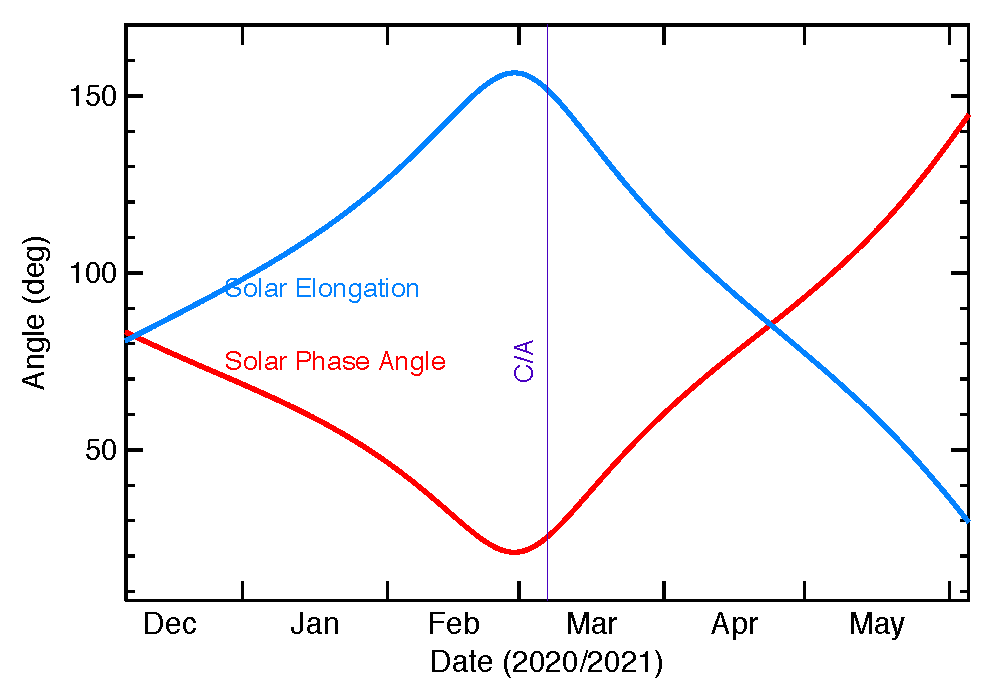
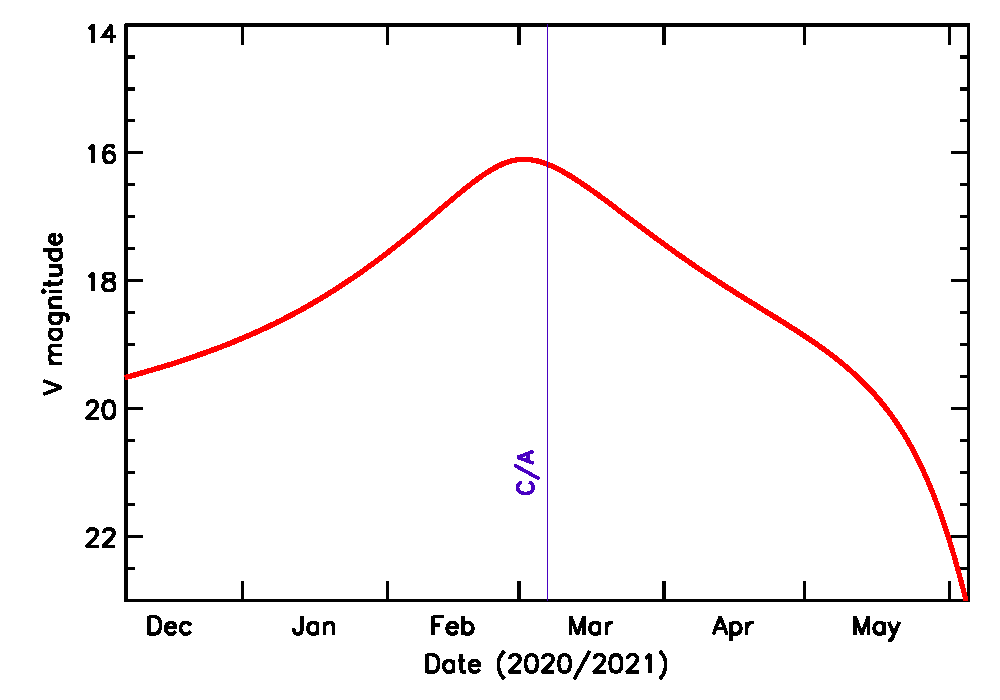
Predicted Brightness
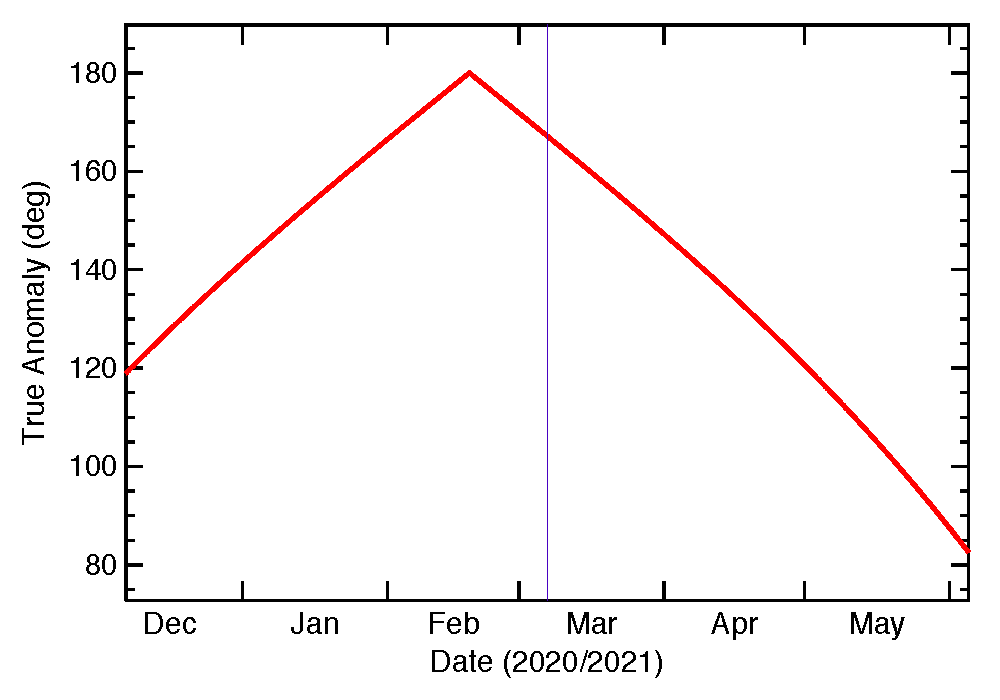
True Anomaly
Notice that the true anomaly may have a discontinuity at close approach, which is caused by the changes in the asteroid's orbit from the gravitational effects of the Earth.
Rise, set and visibility from different latitudes
The asteroid rises and sets at different times depending on the observer's latitude and longitude. The plots below provide information for approximating when the asteroid will be visible, and how long it will be observable from a given location on a given date.
Plots are given for latitude intervals of 5°, which is usually close enough for general planning purposes. Rise and set times are given in UTC for 0° longitude. For other latitudes, these times will be approximate to the local time, which should again be sufficient for basic planning purposes. Note, however, that there will be an offset (typically < 1/2 hr) for different longitudes, so if more accuracy is needed, then you should obtain a more detailed ephemeris.
How to read these plots
We provide a more detailed description of the Rise/Set and visibility plots, and an example of how to read the information here (PDF).
Asteroid visibility (TimeUp) and Rise/Set plots
If there is another major observatory for which you'd like to see details, please let know.
| 2021 Encounter | ||
|---|---|---|
| Goldstone (+35.4) | Timeup | Rise/Set |
| DCT (+34.7) | Timeup | Rise/Set |
| Spacewatch (+32) | Timeup | Rise/Set |
| La Palma (+28.8) | Timeup | Rise/Set |
| IRTF (+19.8) | Timeup | Rise/Set |
| Arecibo (+18.4) | Timeup | Rise/Set |
| La Silla (-29) | Timeup | Rise/Set |
| CTIO (-30.2) | Timeup | Rise/Set |
| Sutherland (-32.4) | Timeup | Rise/Set |
2027
Observing Geometry for the 2027 Apparition
The plots presented here are for general planning purposes. If you need more detailed values for the different geometric conditions, use the JPL Horizons routines to compute the values for your specific situation.
Geometry was computed using the orbital solution JPL#199.
Geometry Data File
The geometric data plotted below is included in ASCII format in this Data File.
Right Ascension and Declination
Note that the width of the line reflects the objects estimated brightness, which is plotted below.
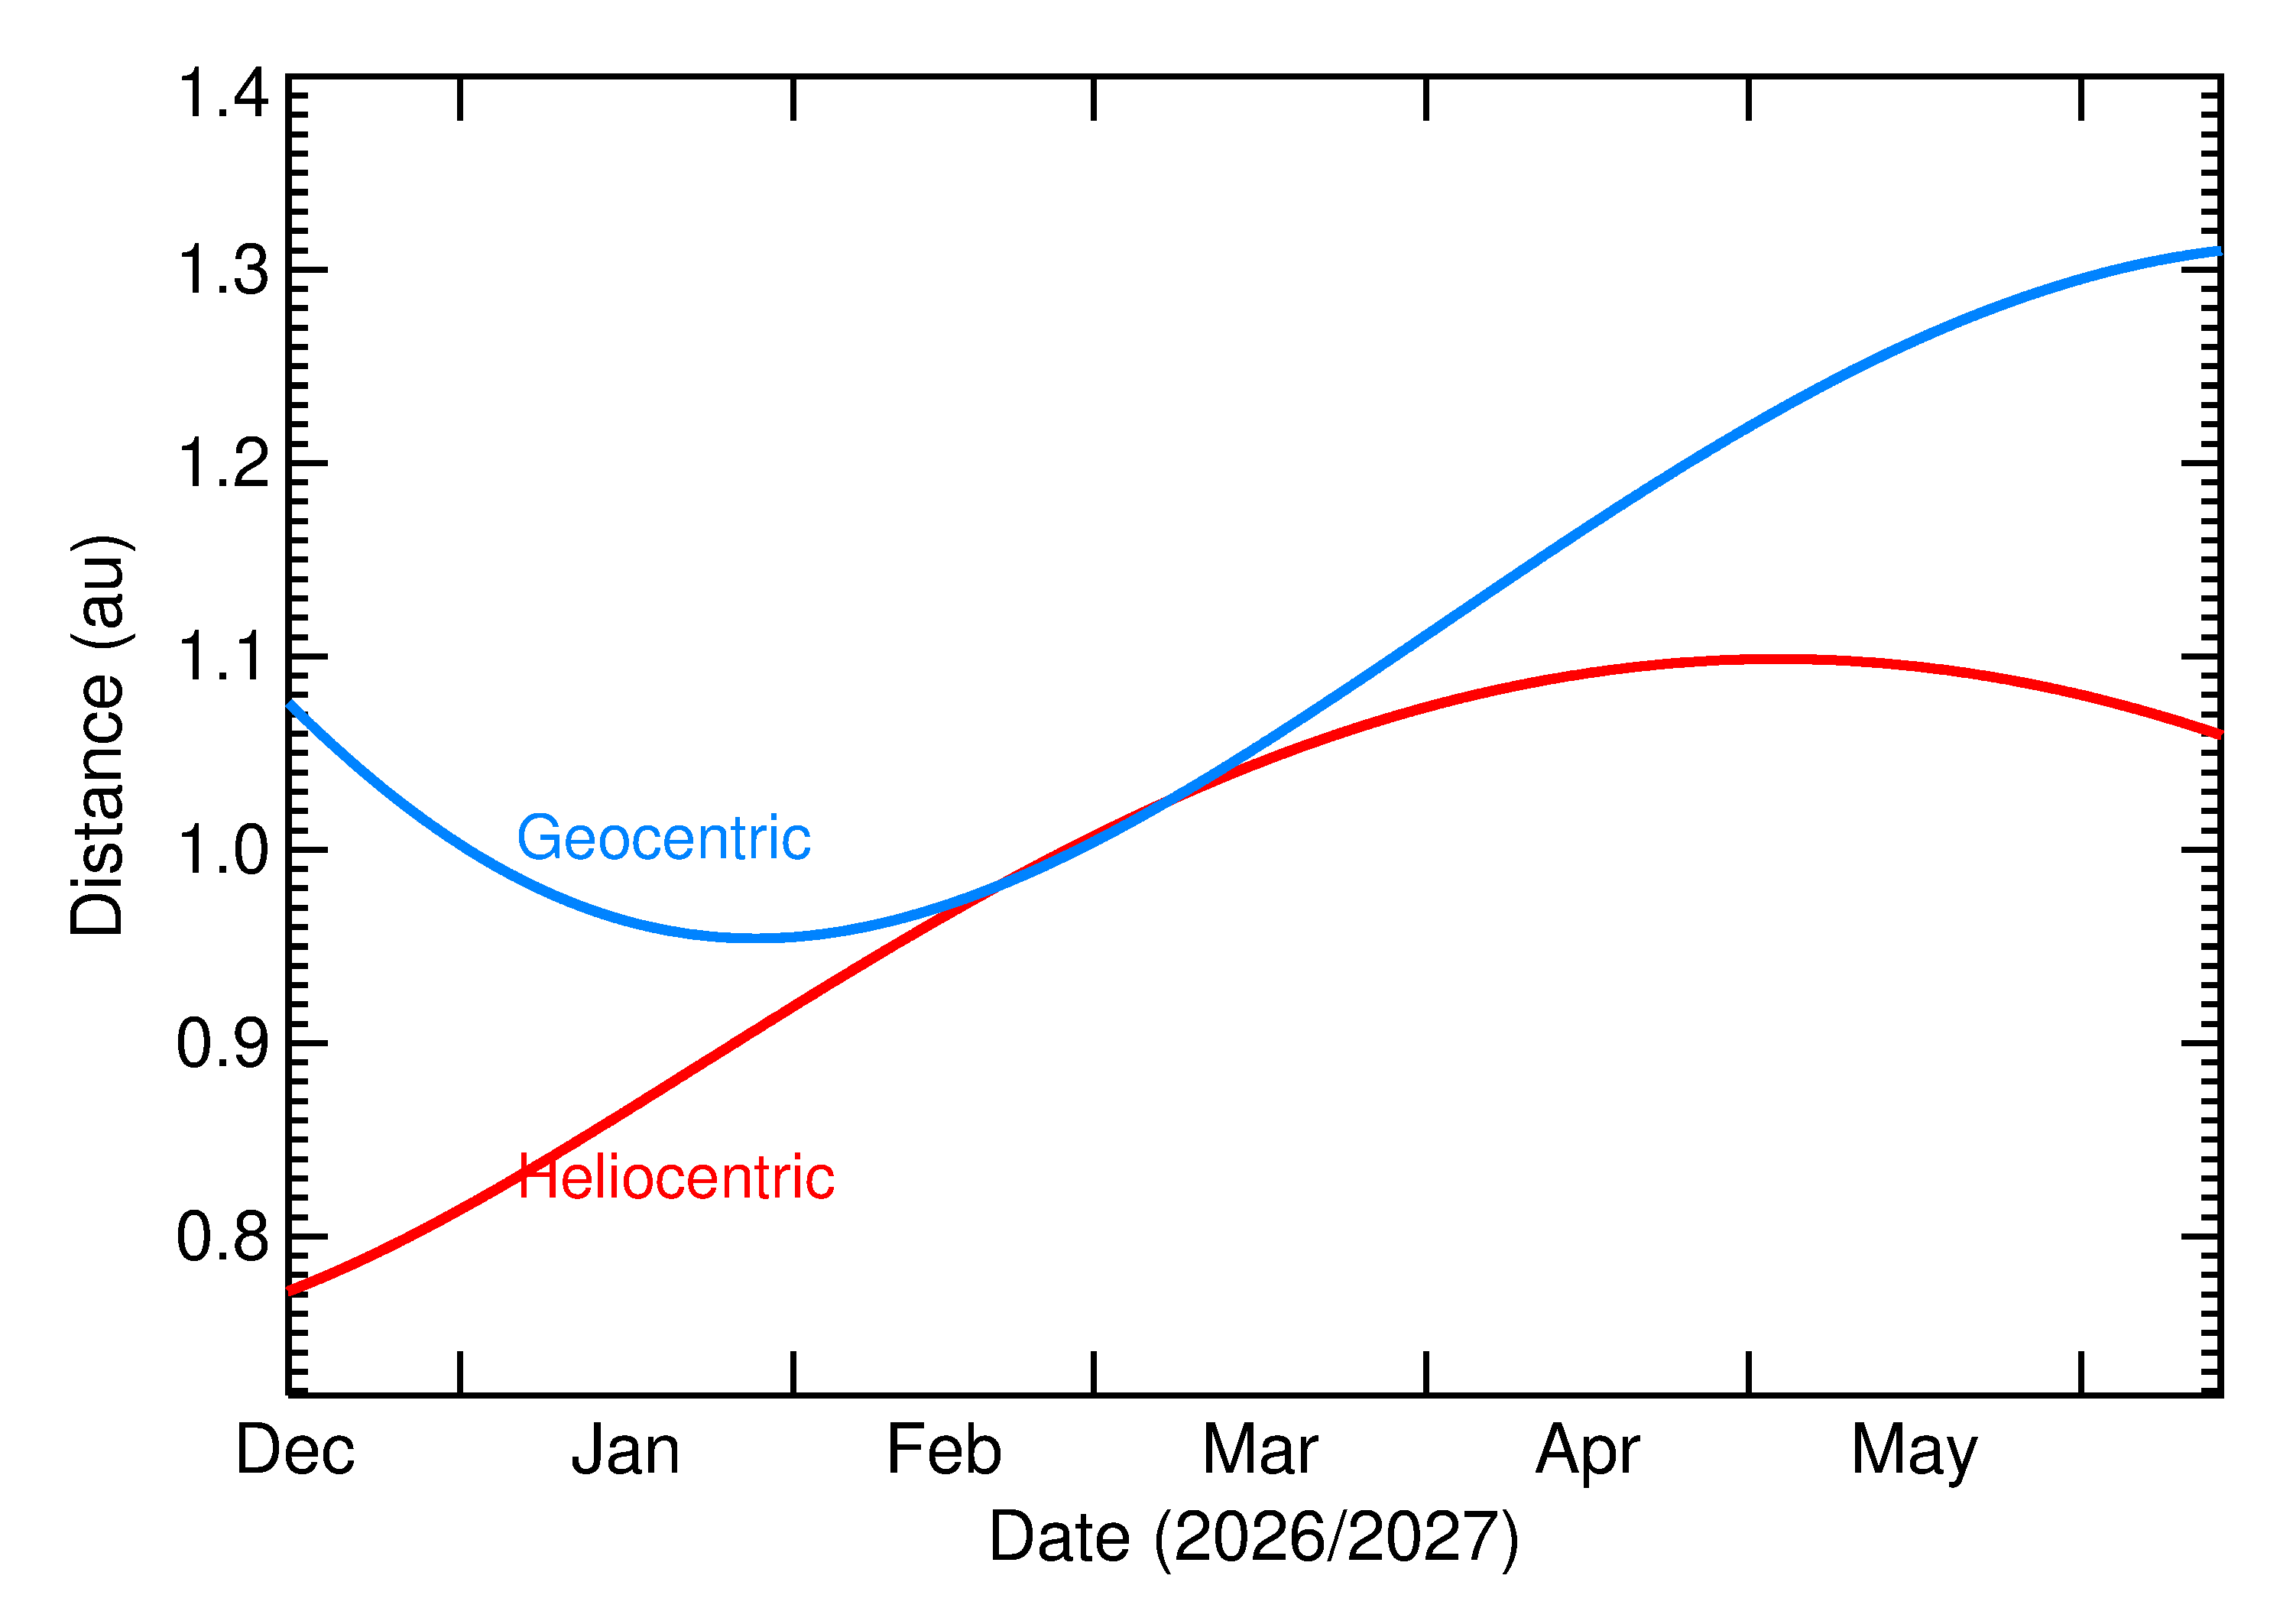
Heliocentric and Geocentric Distances
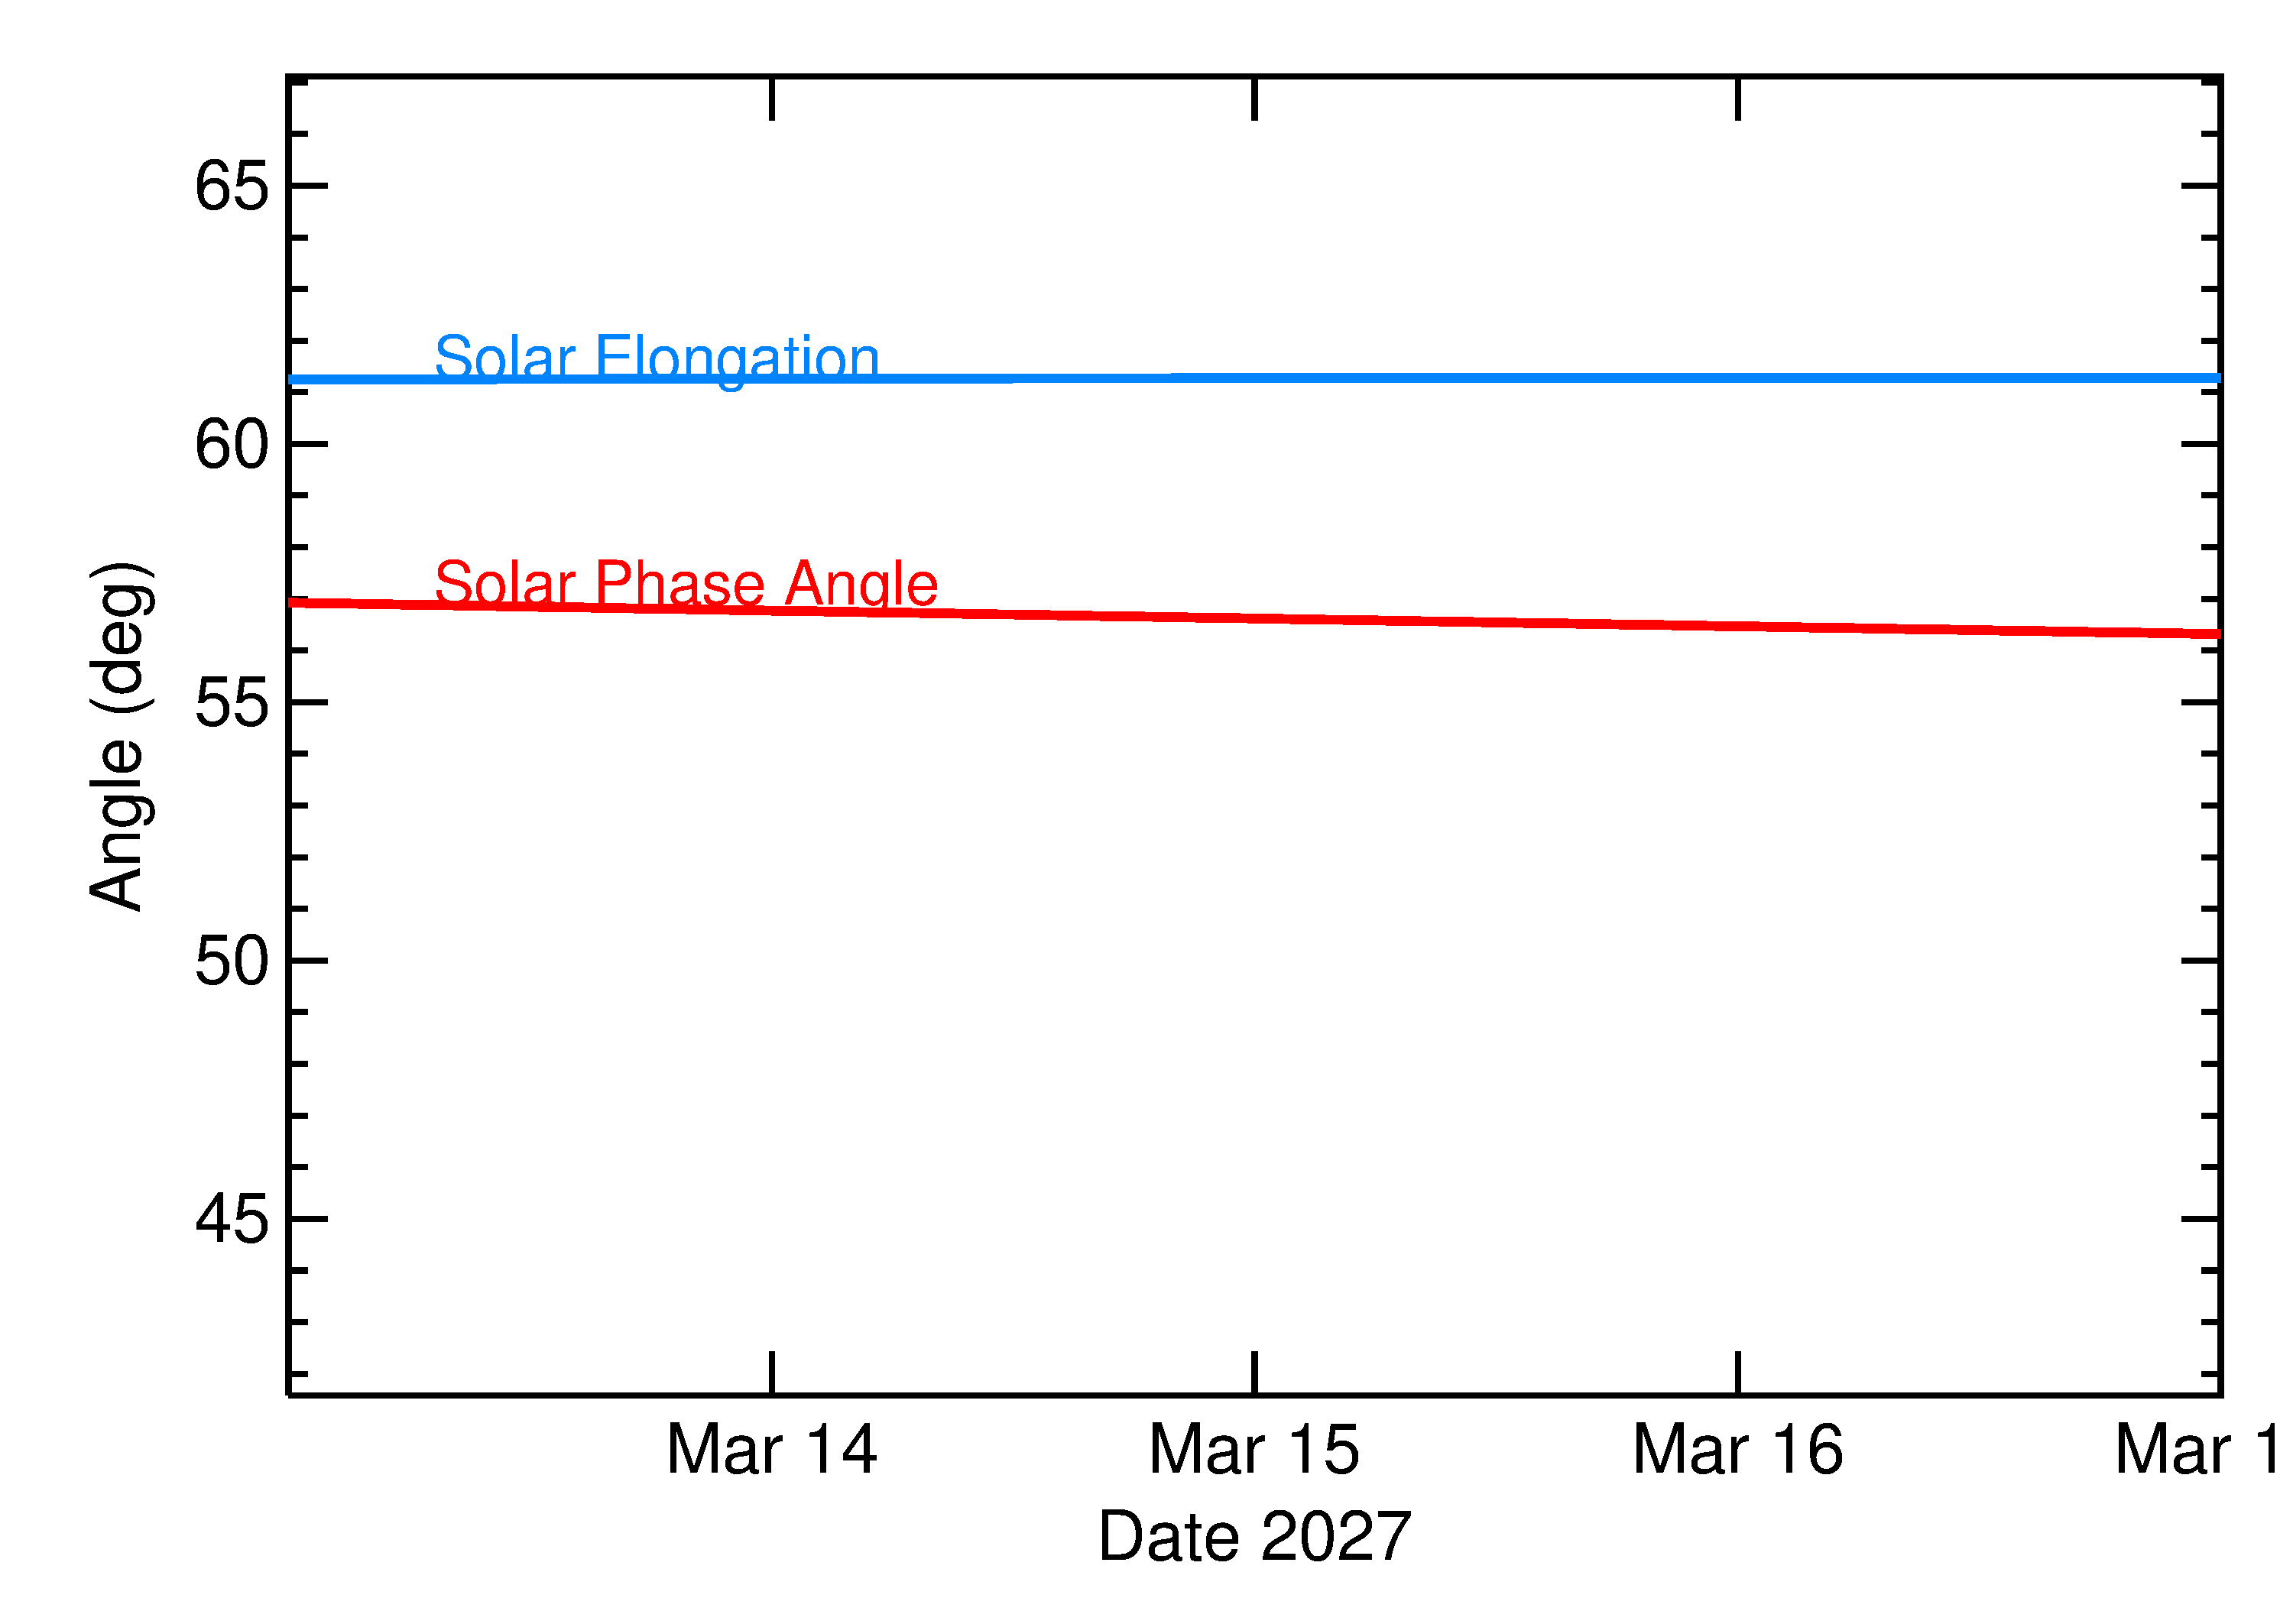
Solar Elongation and Solar Phase Angle
Expanded view of the angles around close approach: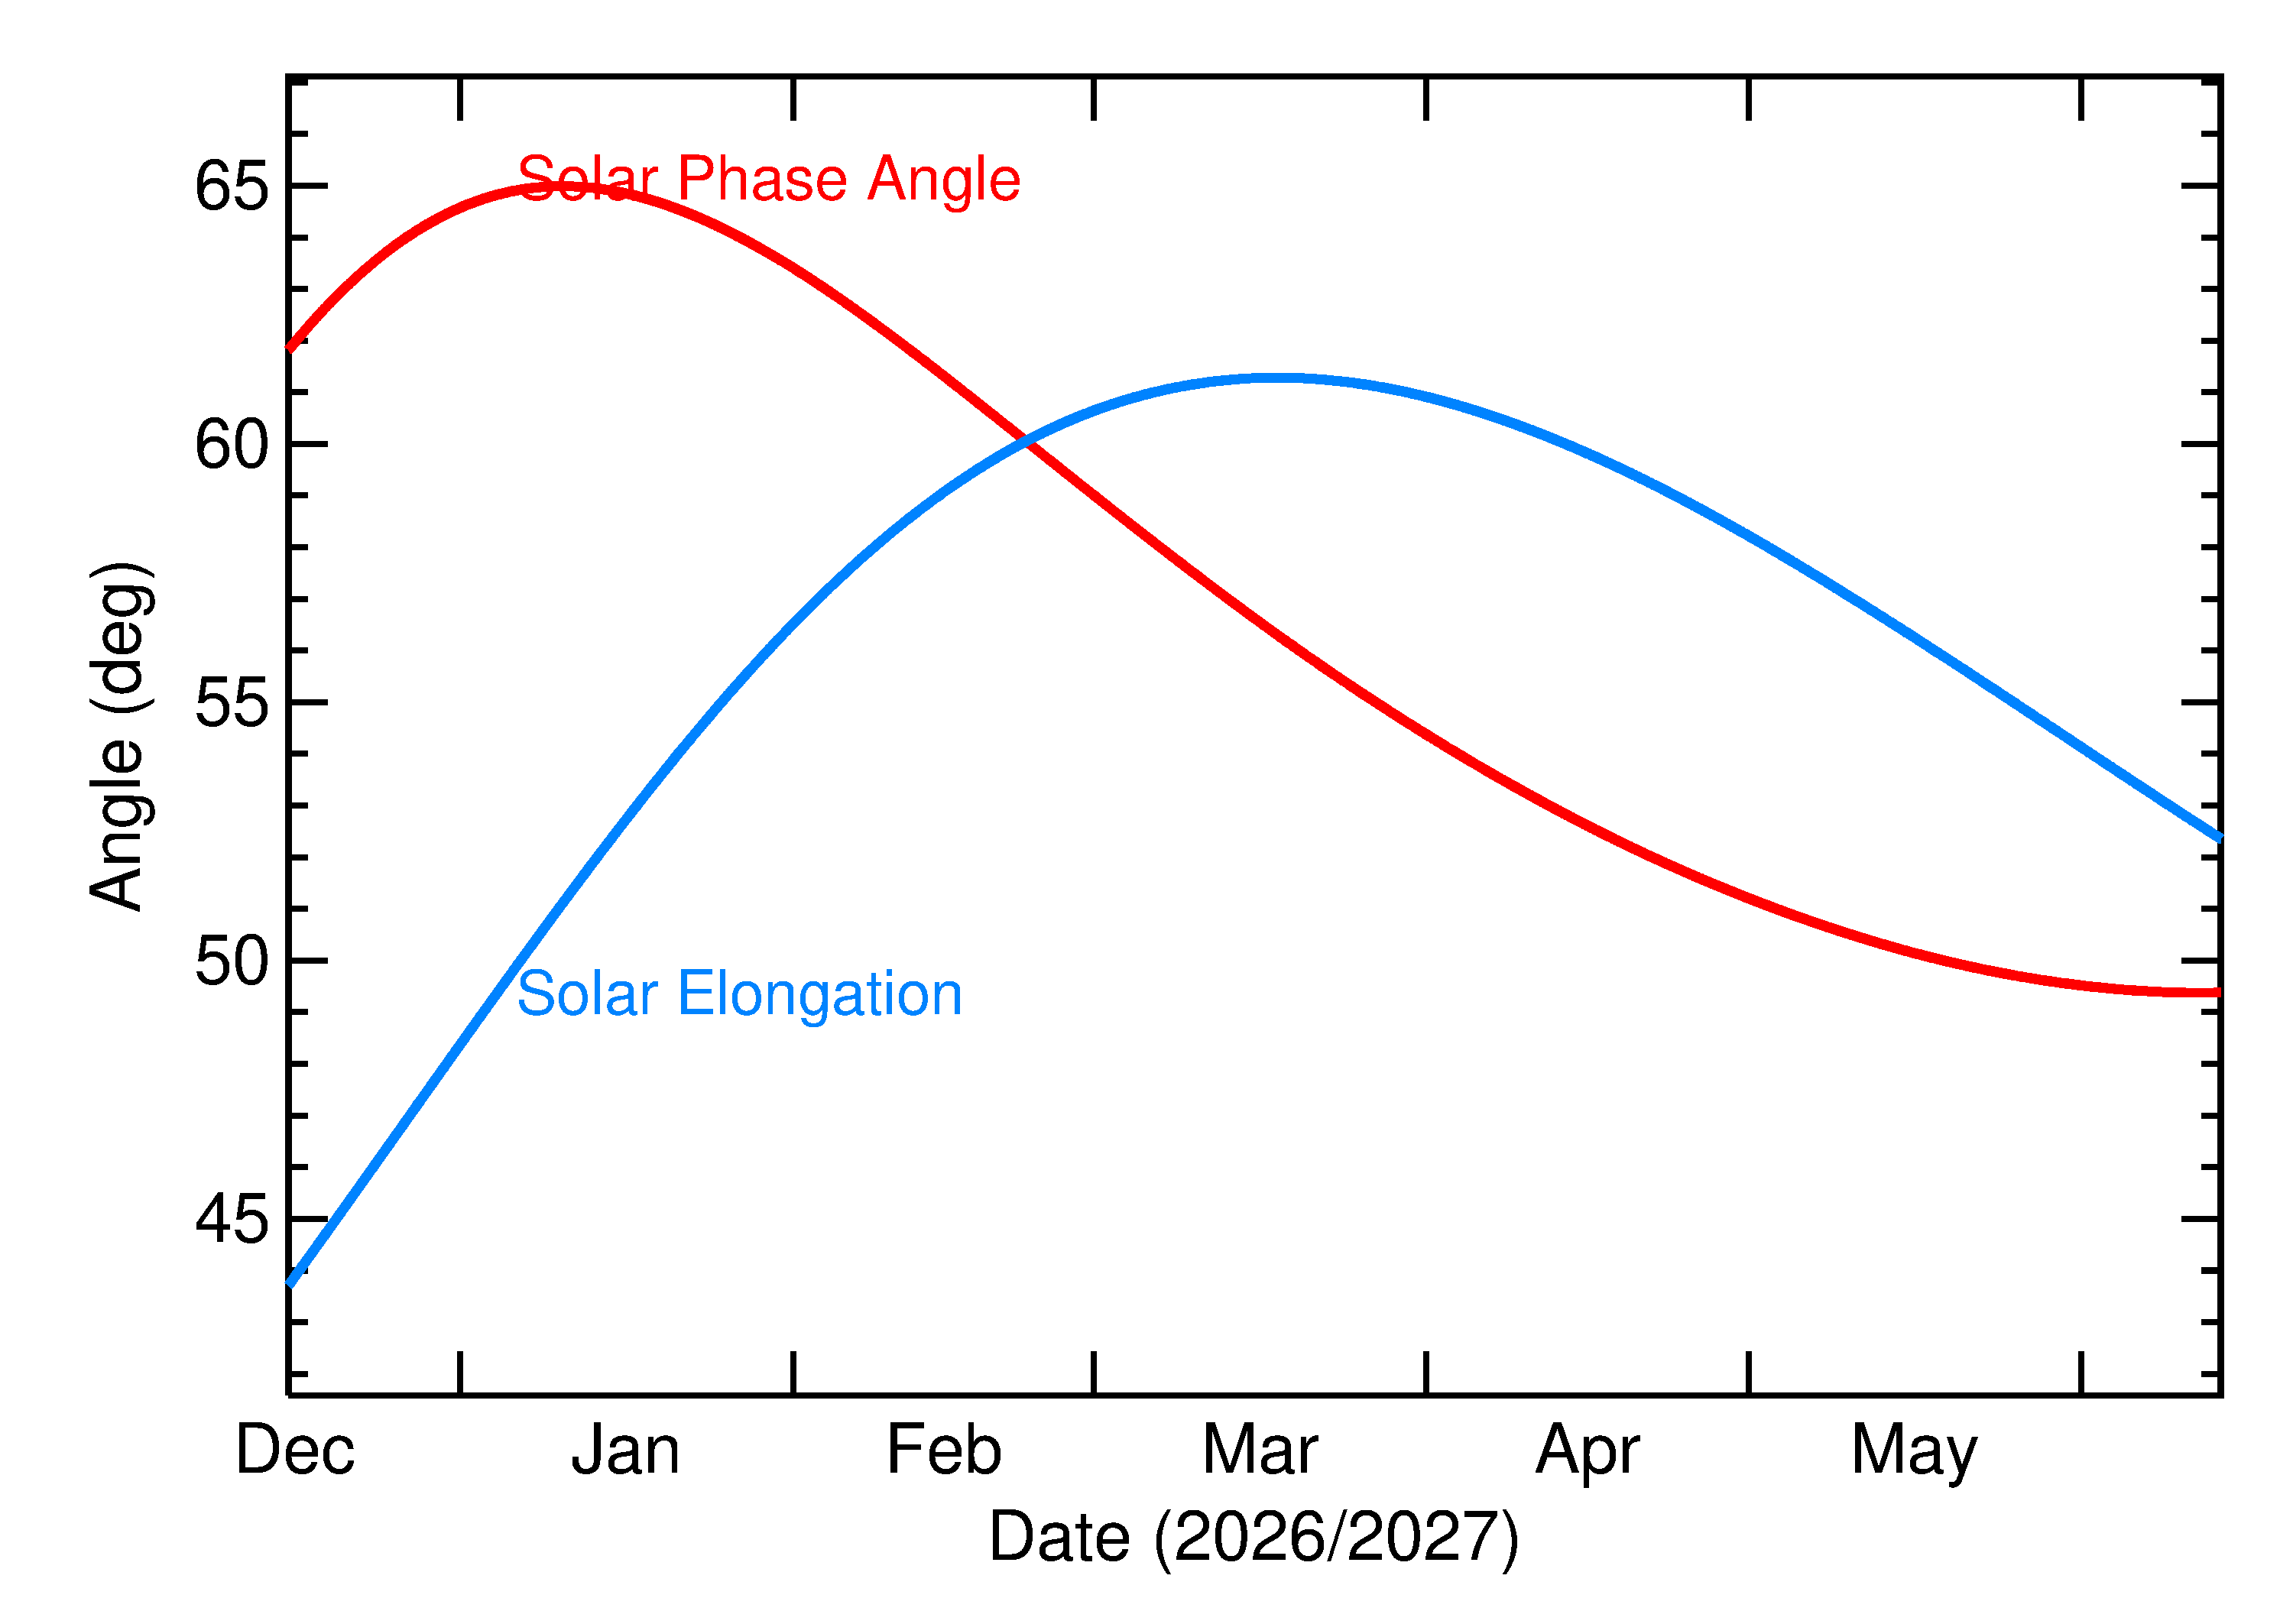
Rate of Motion
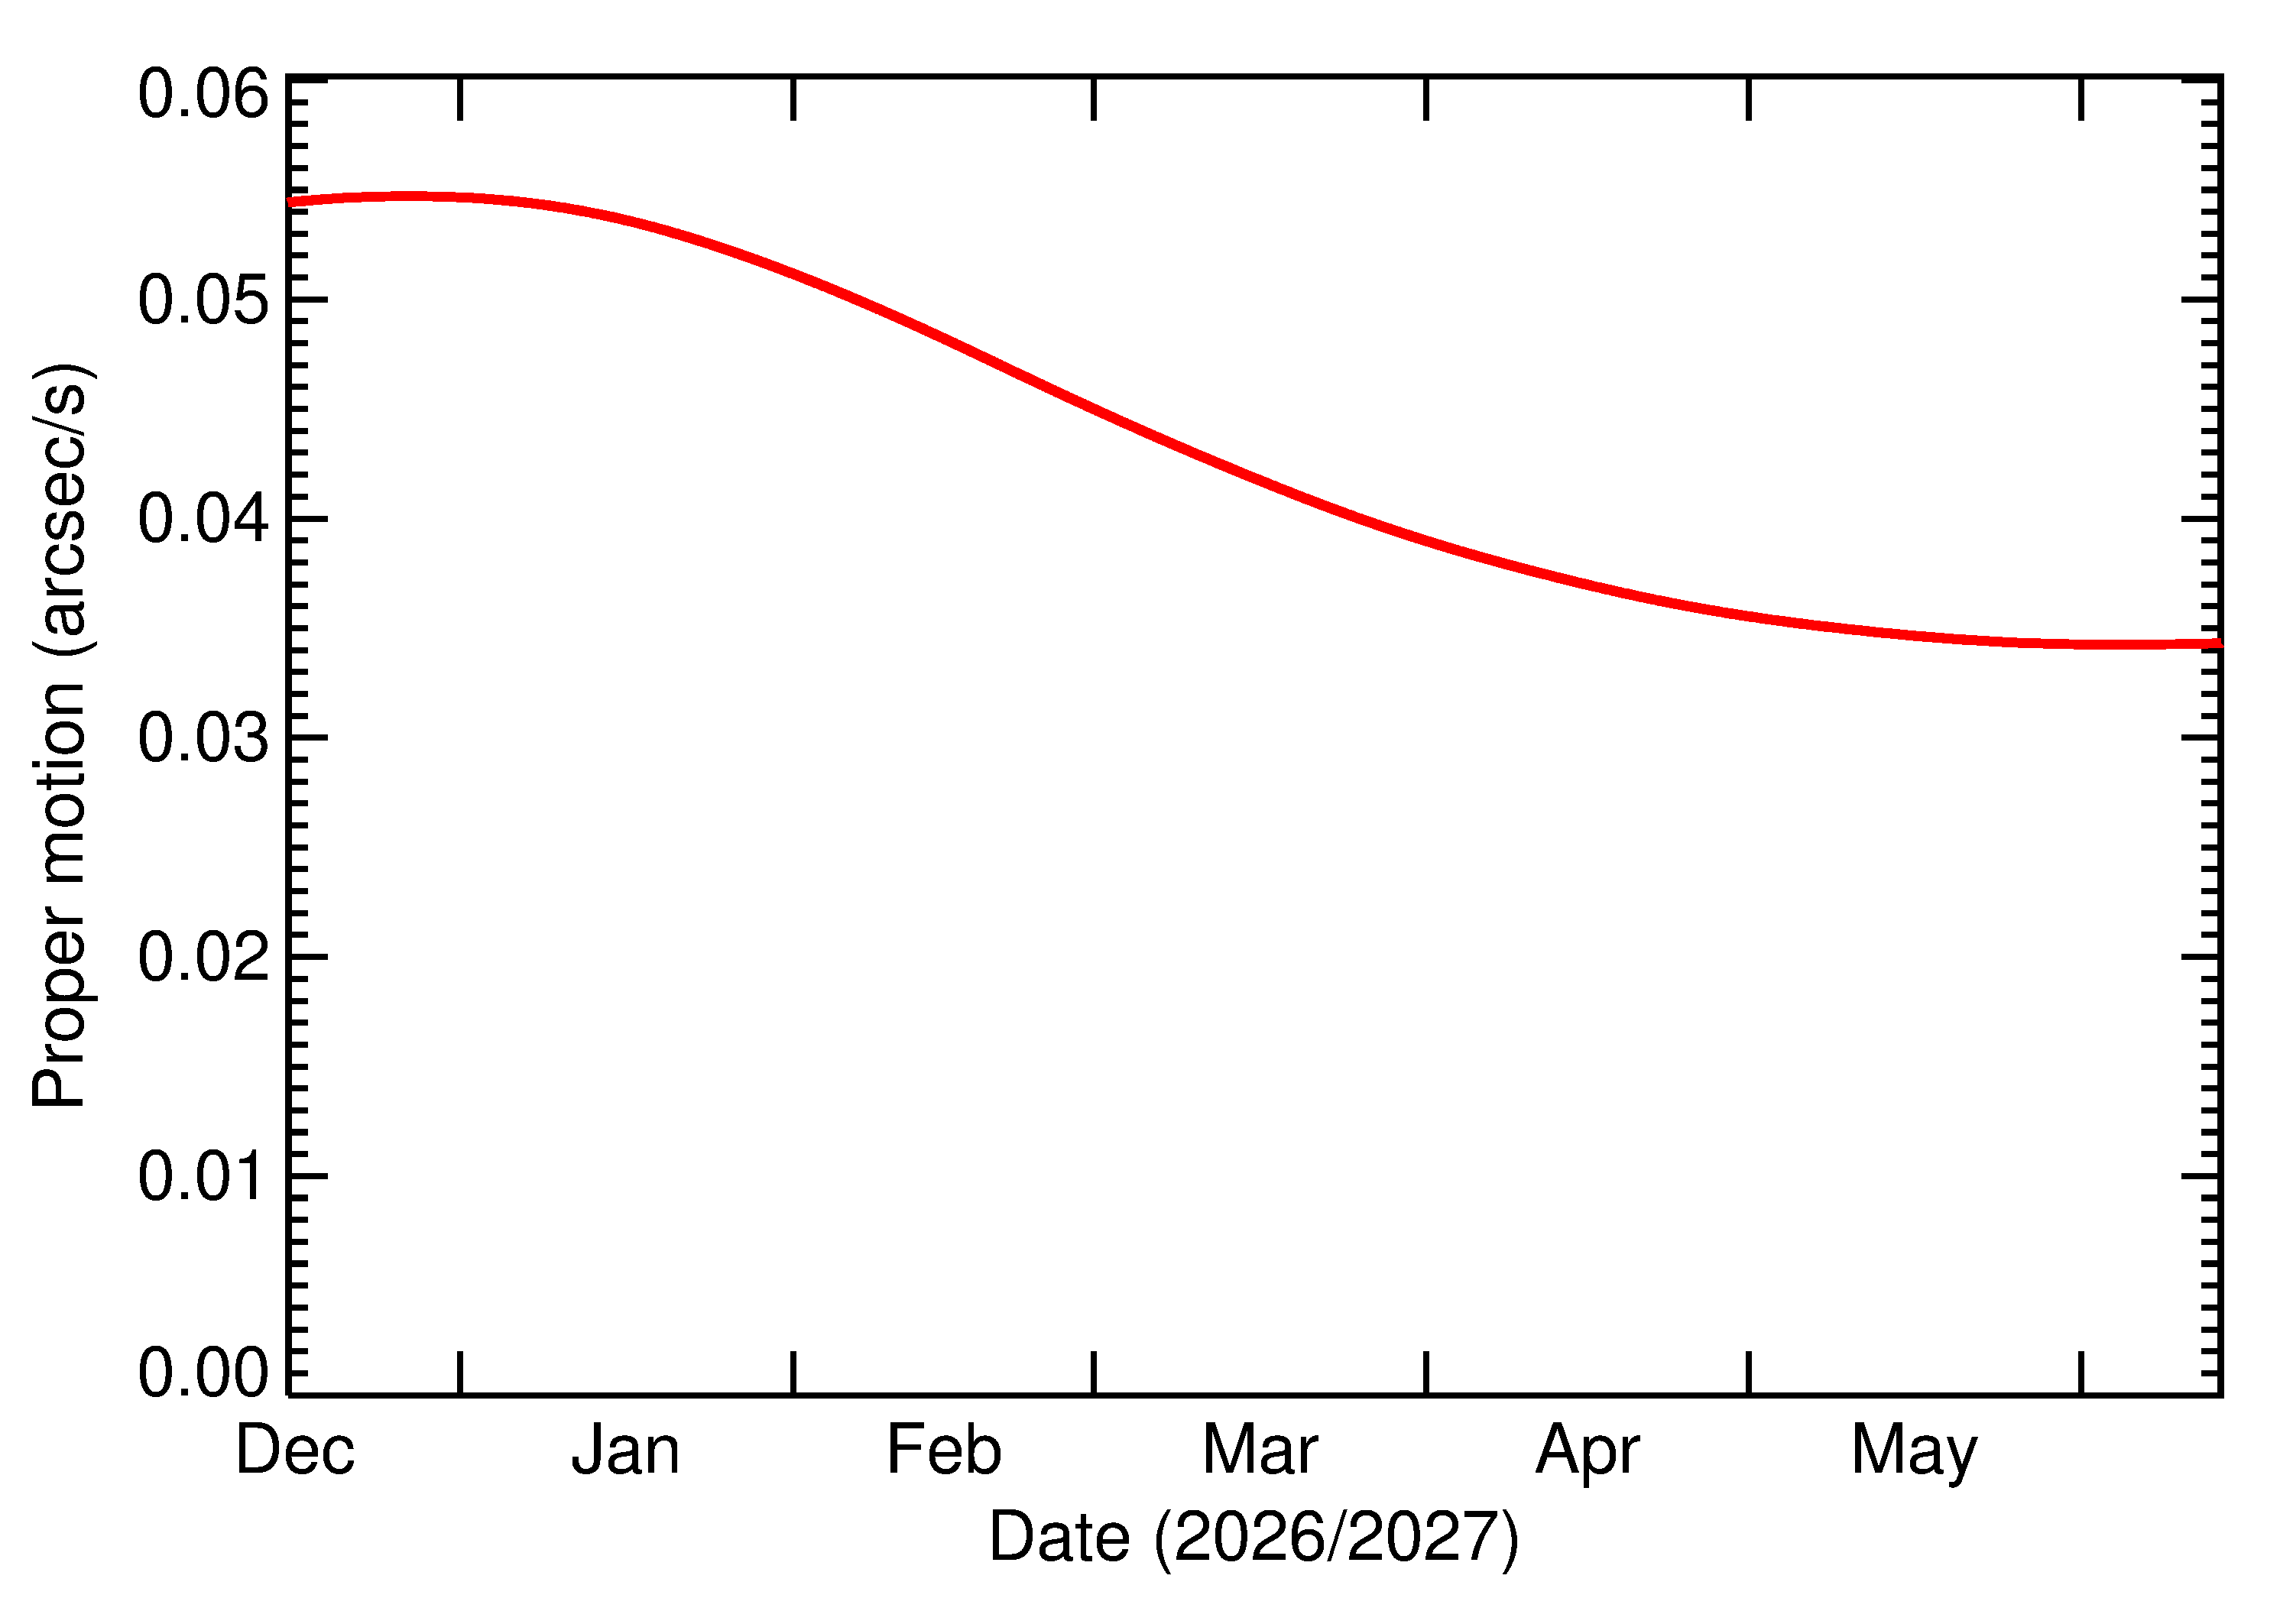
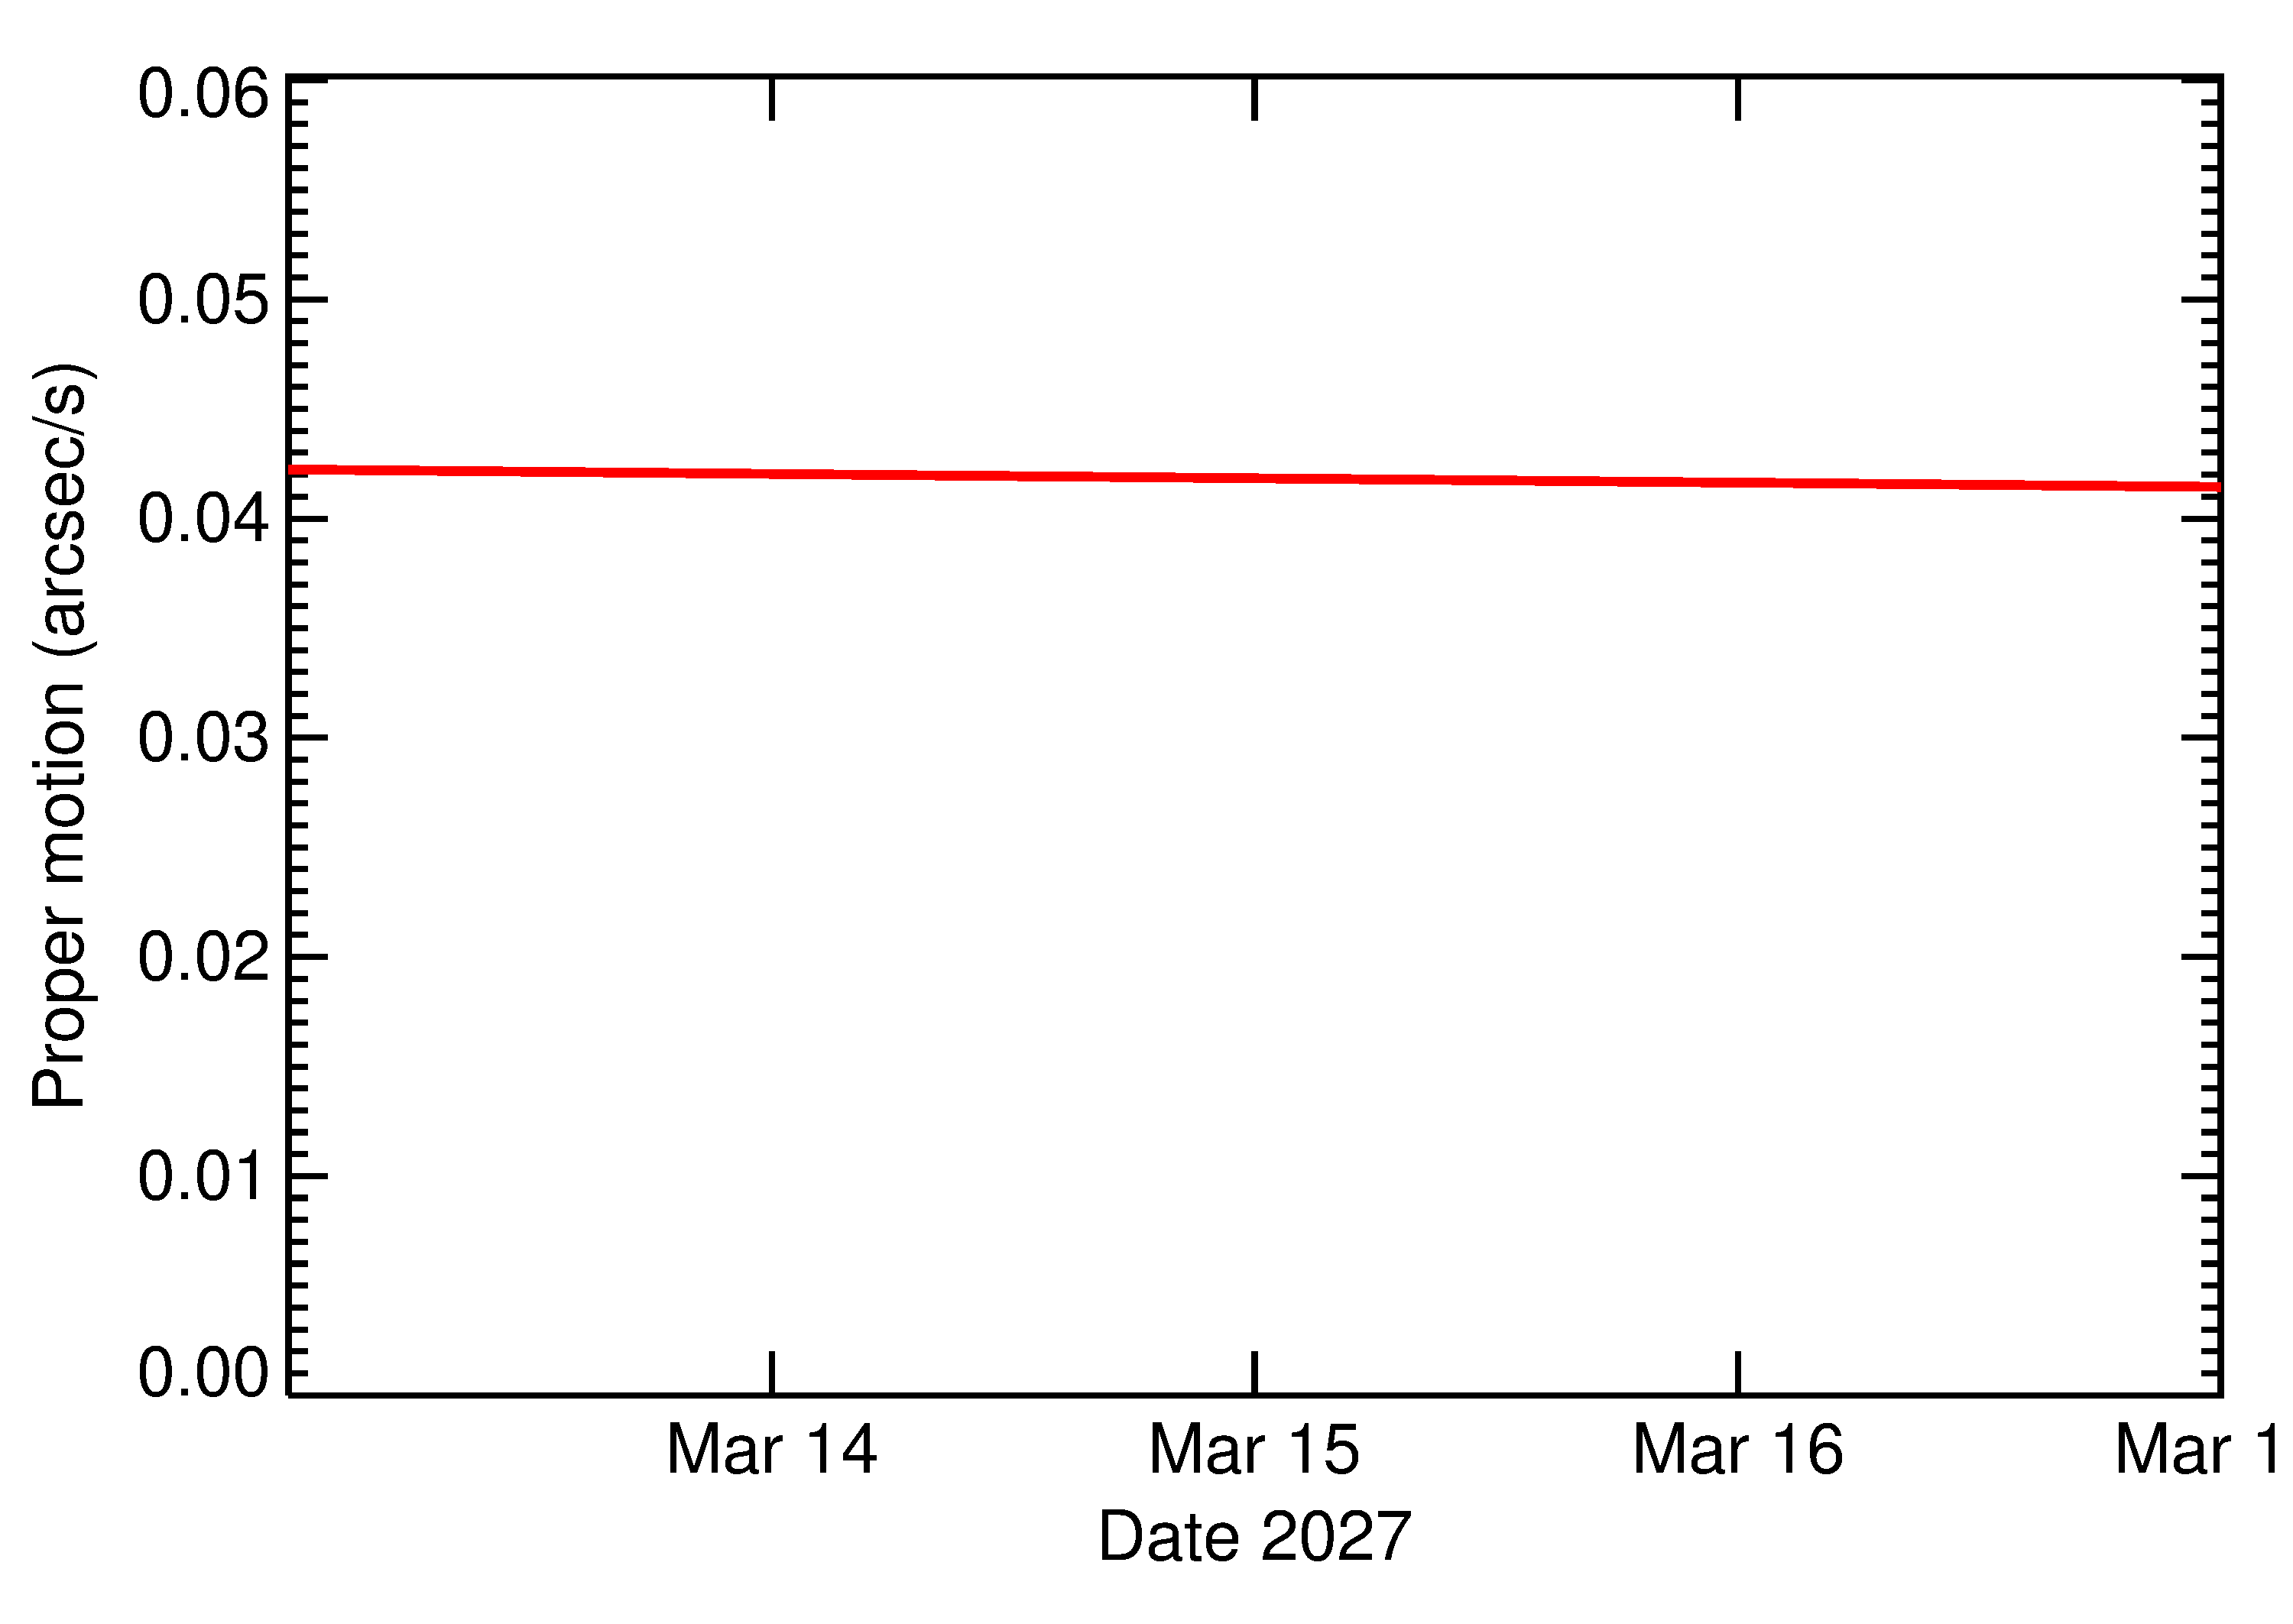
Apophis_rates.pdf
Apophis_rates2.pdf
Predicted Brightness
True Anomaly
Notice that the true anomaly may have a discontinuity at close approach, which is caused by the changes in the asteroid's orbit from the gravitational effects of the Earth.
Rise, set and visibility from different latitudes
The asteroid rises and sets at different times depending on the observer's latitude and longitude. The plots below provide information for approximating when the asteroid will be visible, and how long it will be observable from a given location on a given date.
Plots are given for latitude intervals of 5°, which is usually close enough for general planning purposes. Rise and set times are given in UTC for 0° longitude. For other latitudes, these times will be approximate to the local time, which should again be sufficient for basic planning purposes. Note, however, that there will be an offset (typically < 1/2 hr) for different longitudes, so if more accuracy is needed, then you should obtain a more detailed ephemeris.
How to read these plots
We provide a more detailed description of the Rise/Set and visibility plots, and an example of how to read the information here (PDF).
Asteroid visibility (TimeUp) and Rise/Set plots
If there is another major observatory for which you'd like to see details, please let know.
| 2027 Encounter | ||
|---|---|---|
| Goldstone (+35.4) | Timeup | Rise/Set |
| DCT (+34.7) | Timeup | Rise/Set |
| Spacewatch (+32) | Timeup | Rise/Set |
| La Palma (+28.8) | Timeup | Rise/Set |
| IRTF (+19.8) | Timeup | Rise/Set |
| Arecibo (+18.4) | Timeup | Rise/Set |
| La Silla (-29) | Timeup | Rise/Set |
| CTIO (-30.2) | Timeup | Rise/Set |
| Sutherland (-32.4) | Timeup | Rise/Set |
2028
Observing Geometry for the 2028 Apparition
The plots presented here are for general planning purposes. If you need more detailed values for the different geometric conditions, use the JPL Horizons routines to compute the values for your specific situation.
Geometry was computed using the orbital solution JPL#199.
Geometry Data File
The geometric data plotted below is included in ASCII format in this Data File.
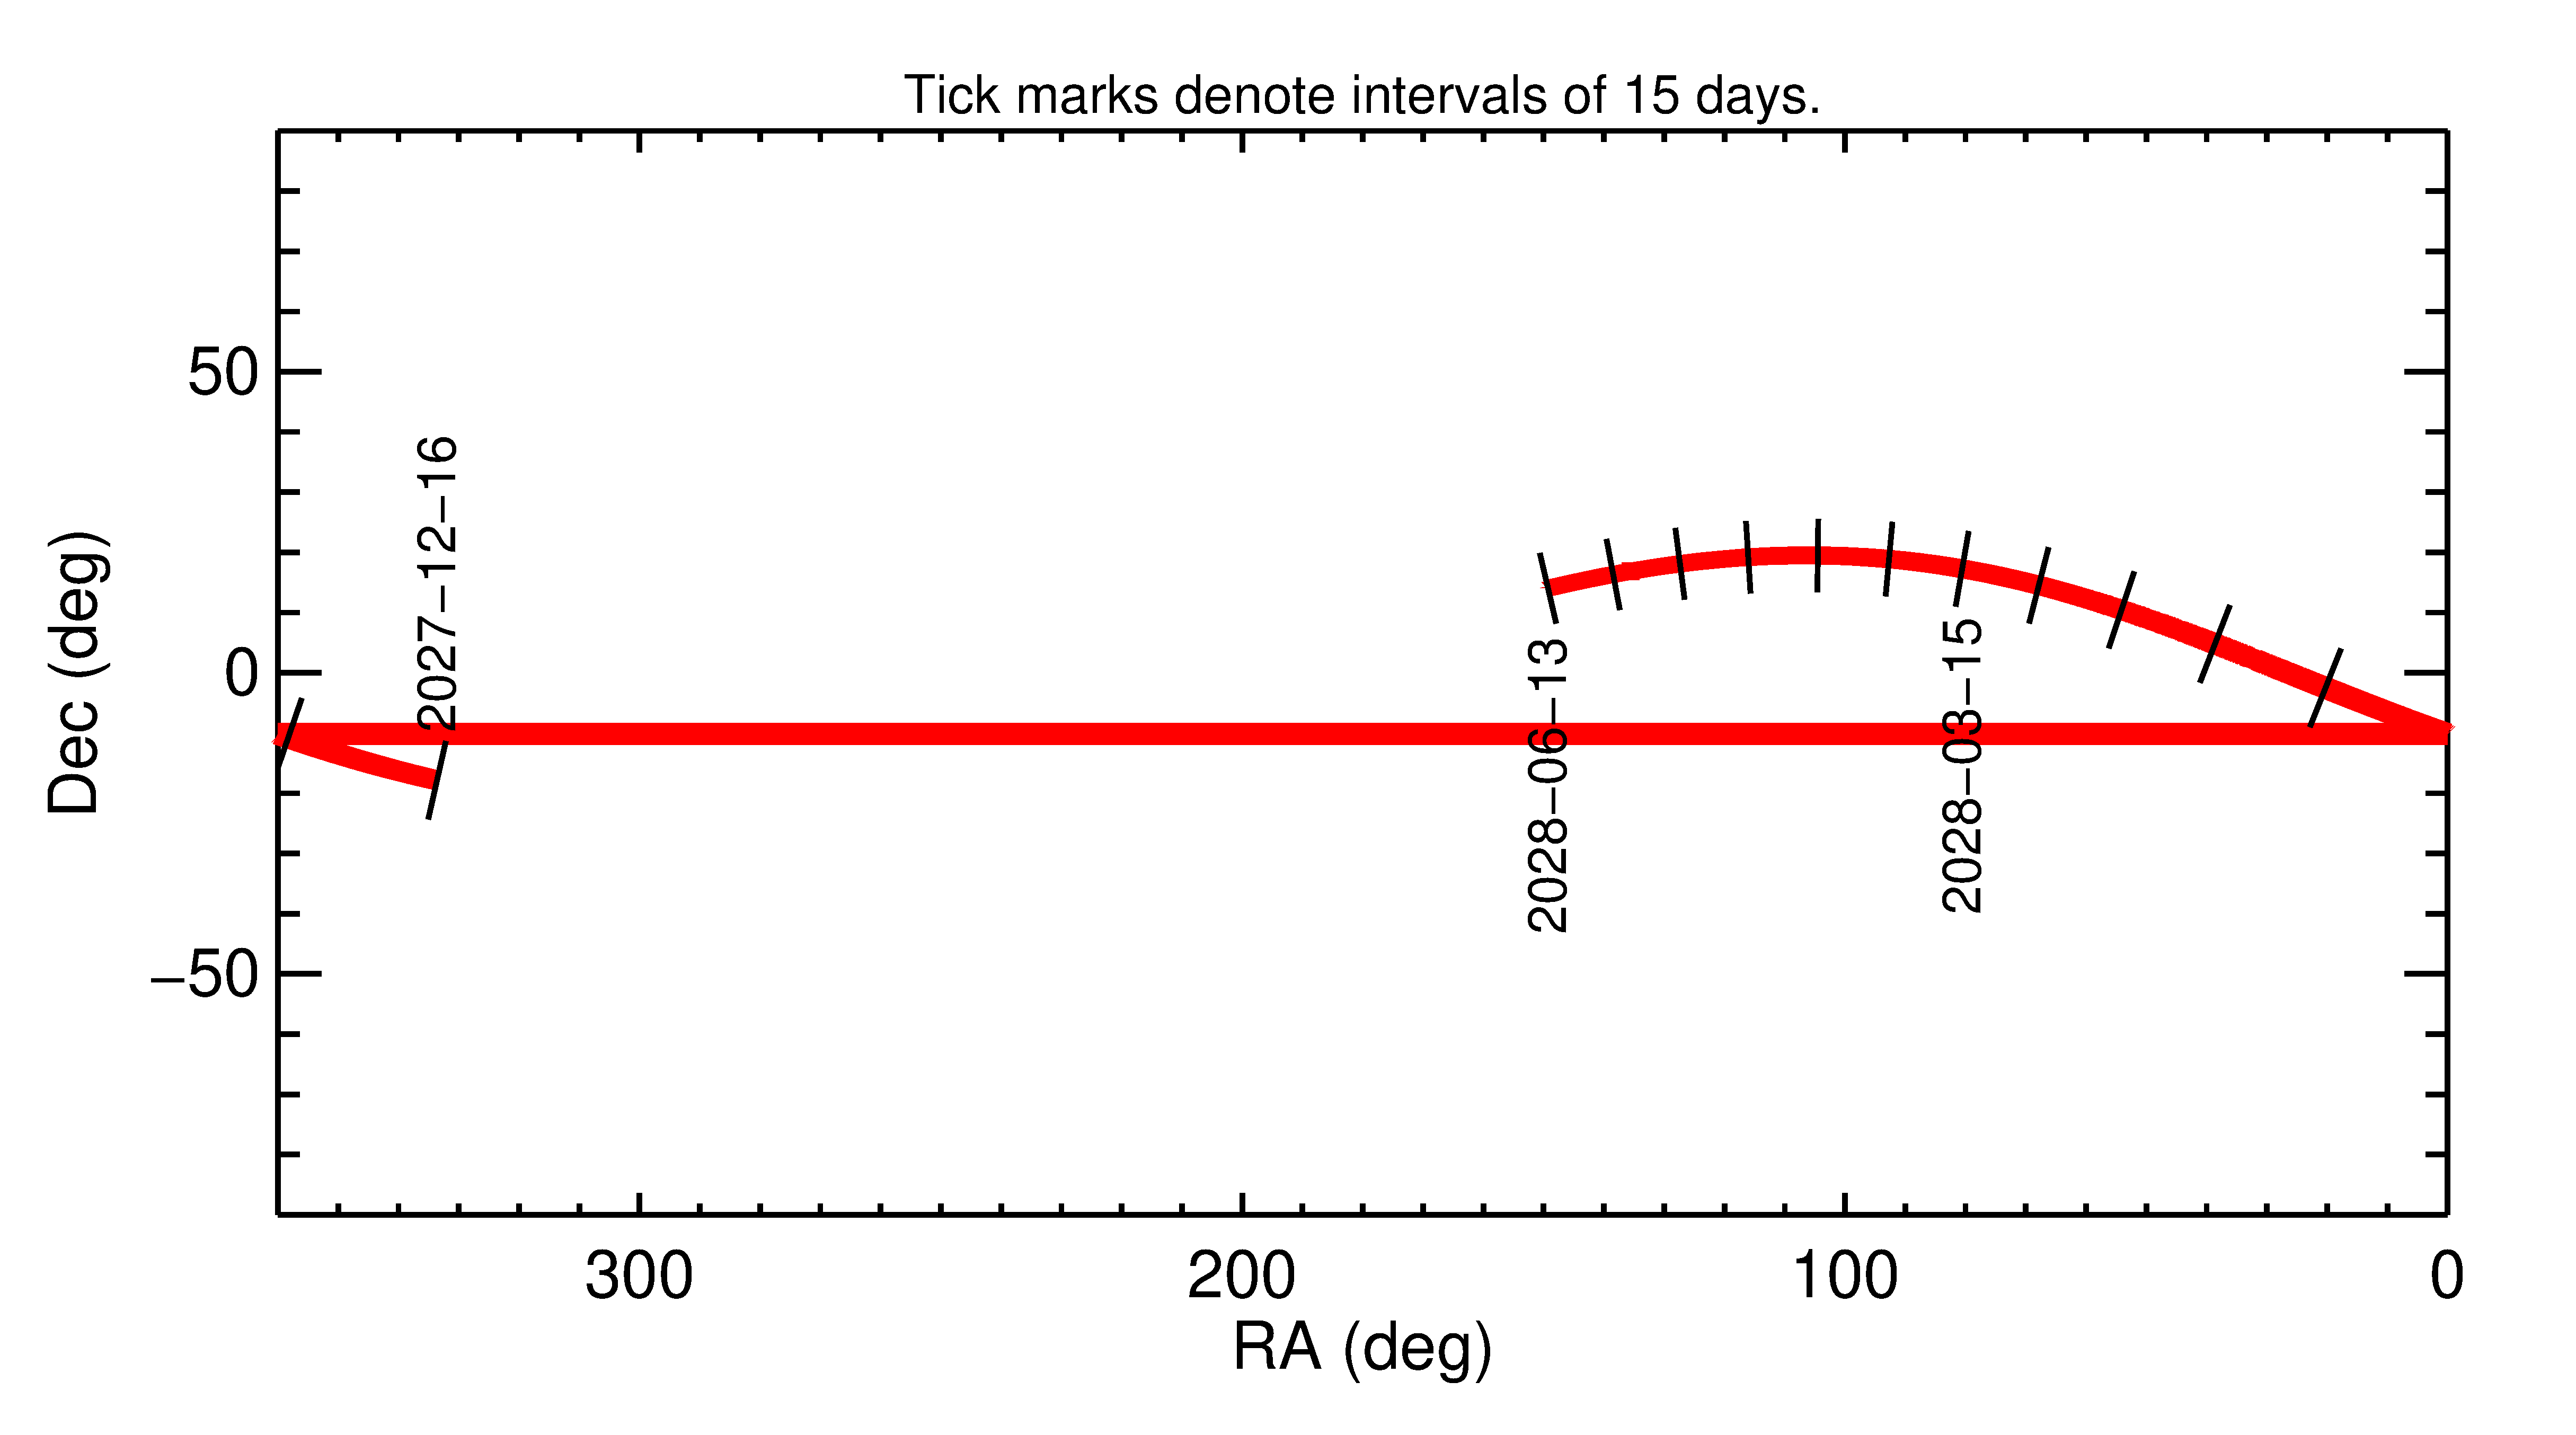
Right Ascension and Declination
Note that the width of the line reflects the objects estimated brightness, which is plotted below.
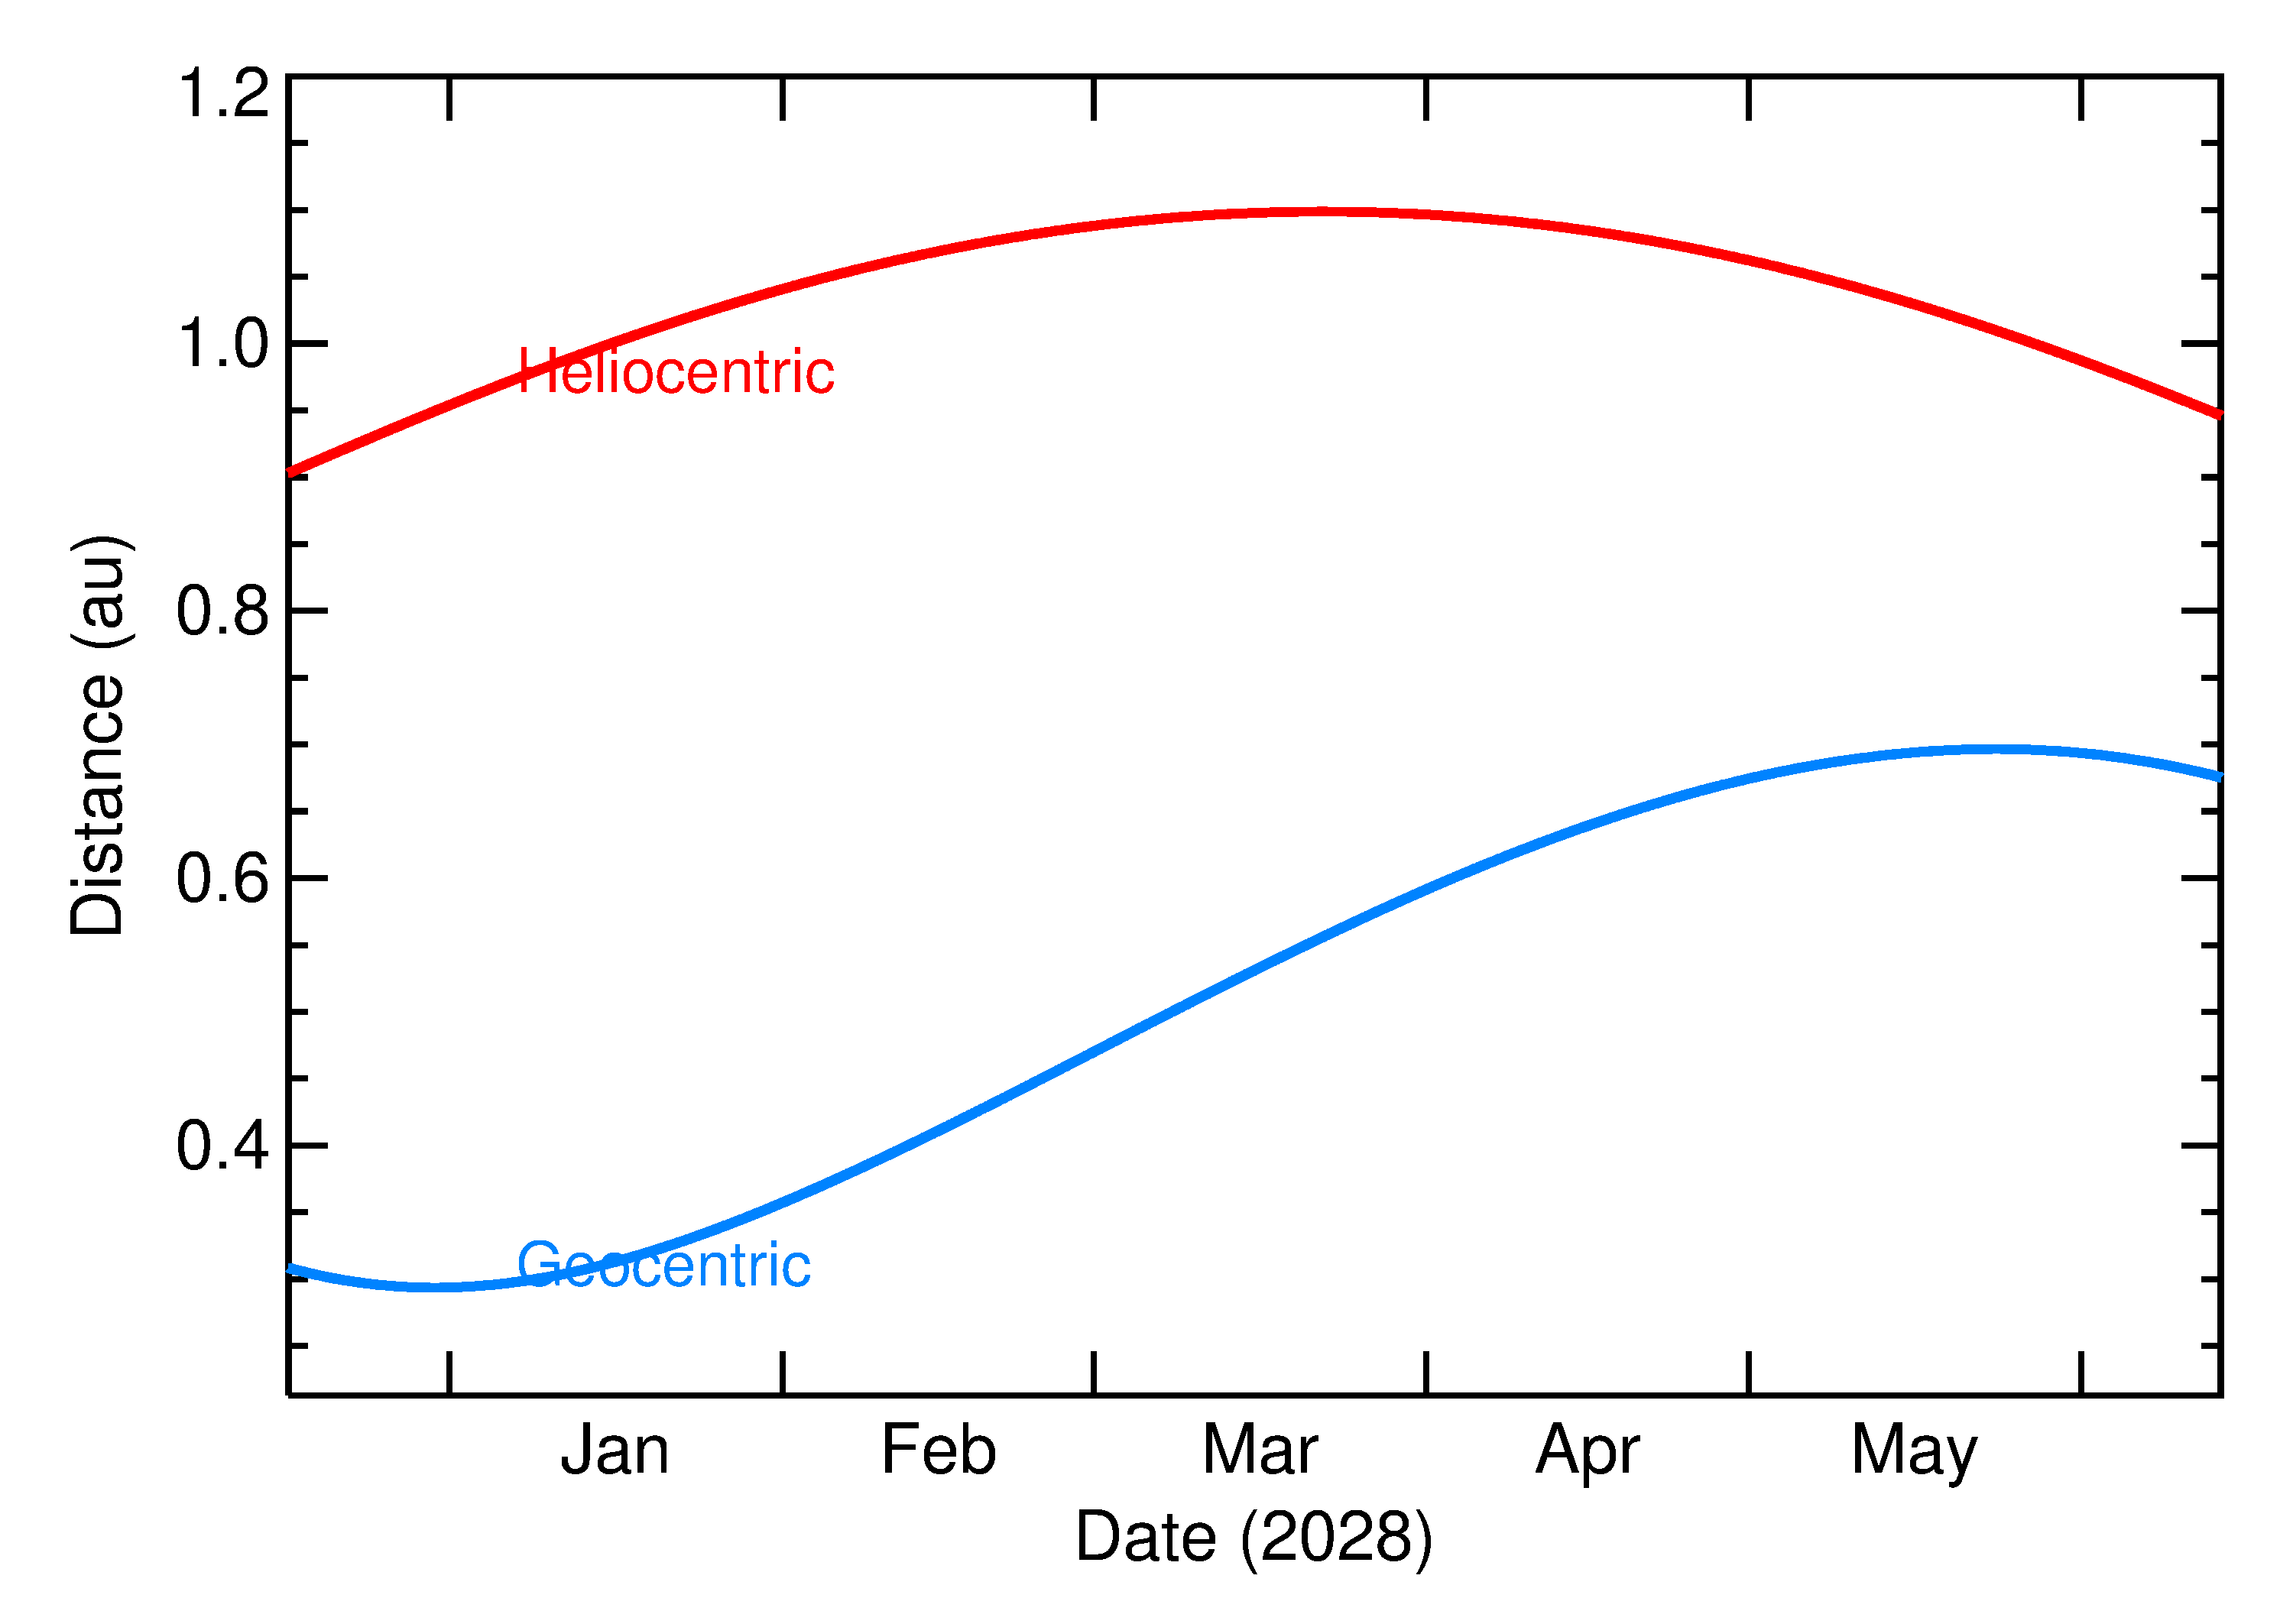
Heliocentric and Geocentric Distances
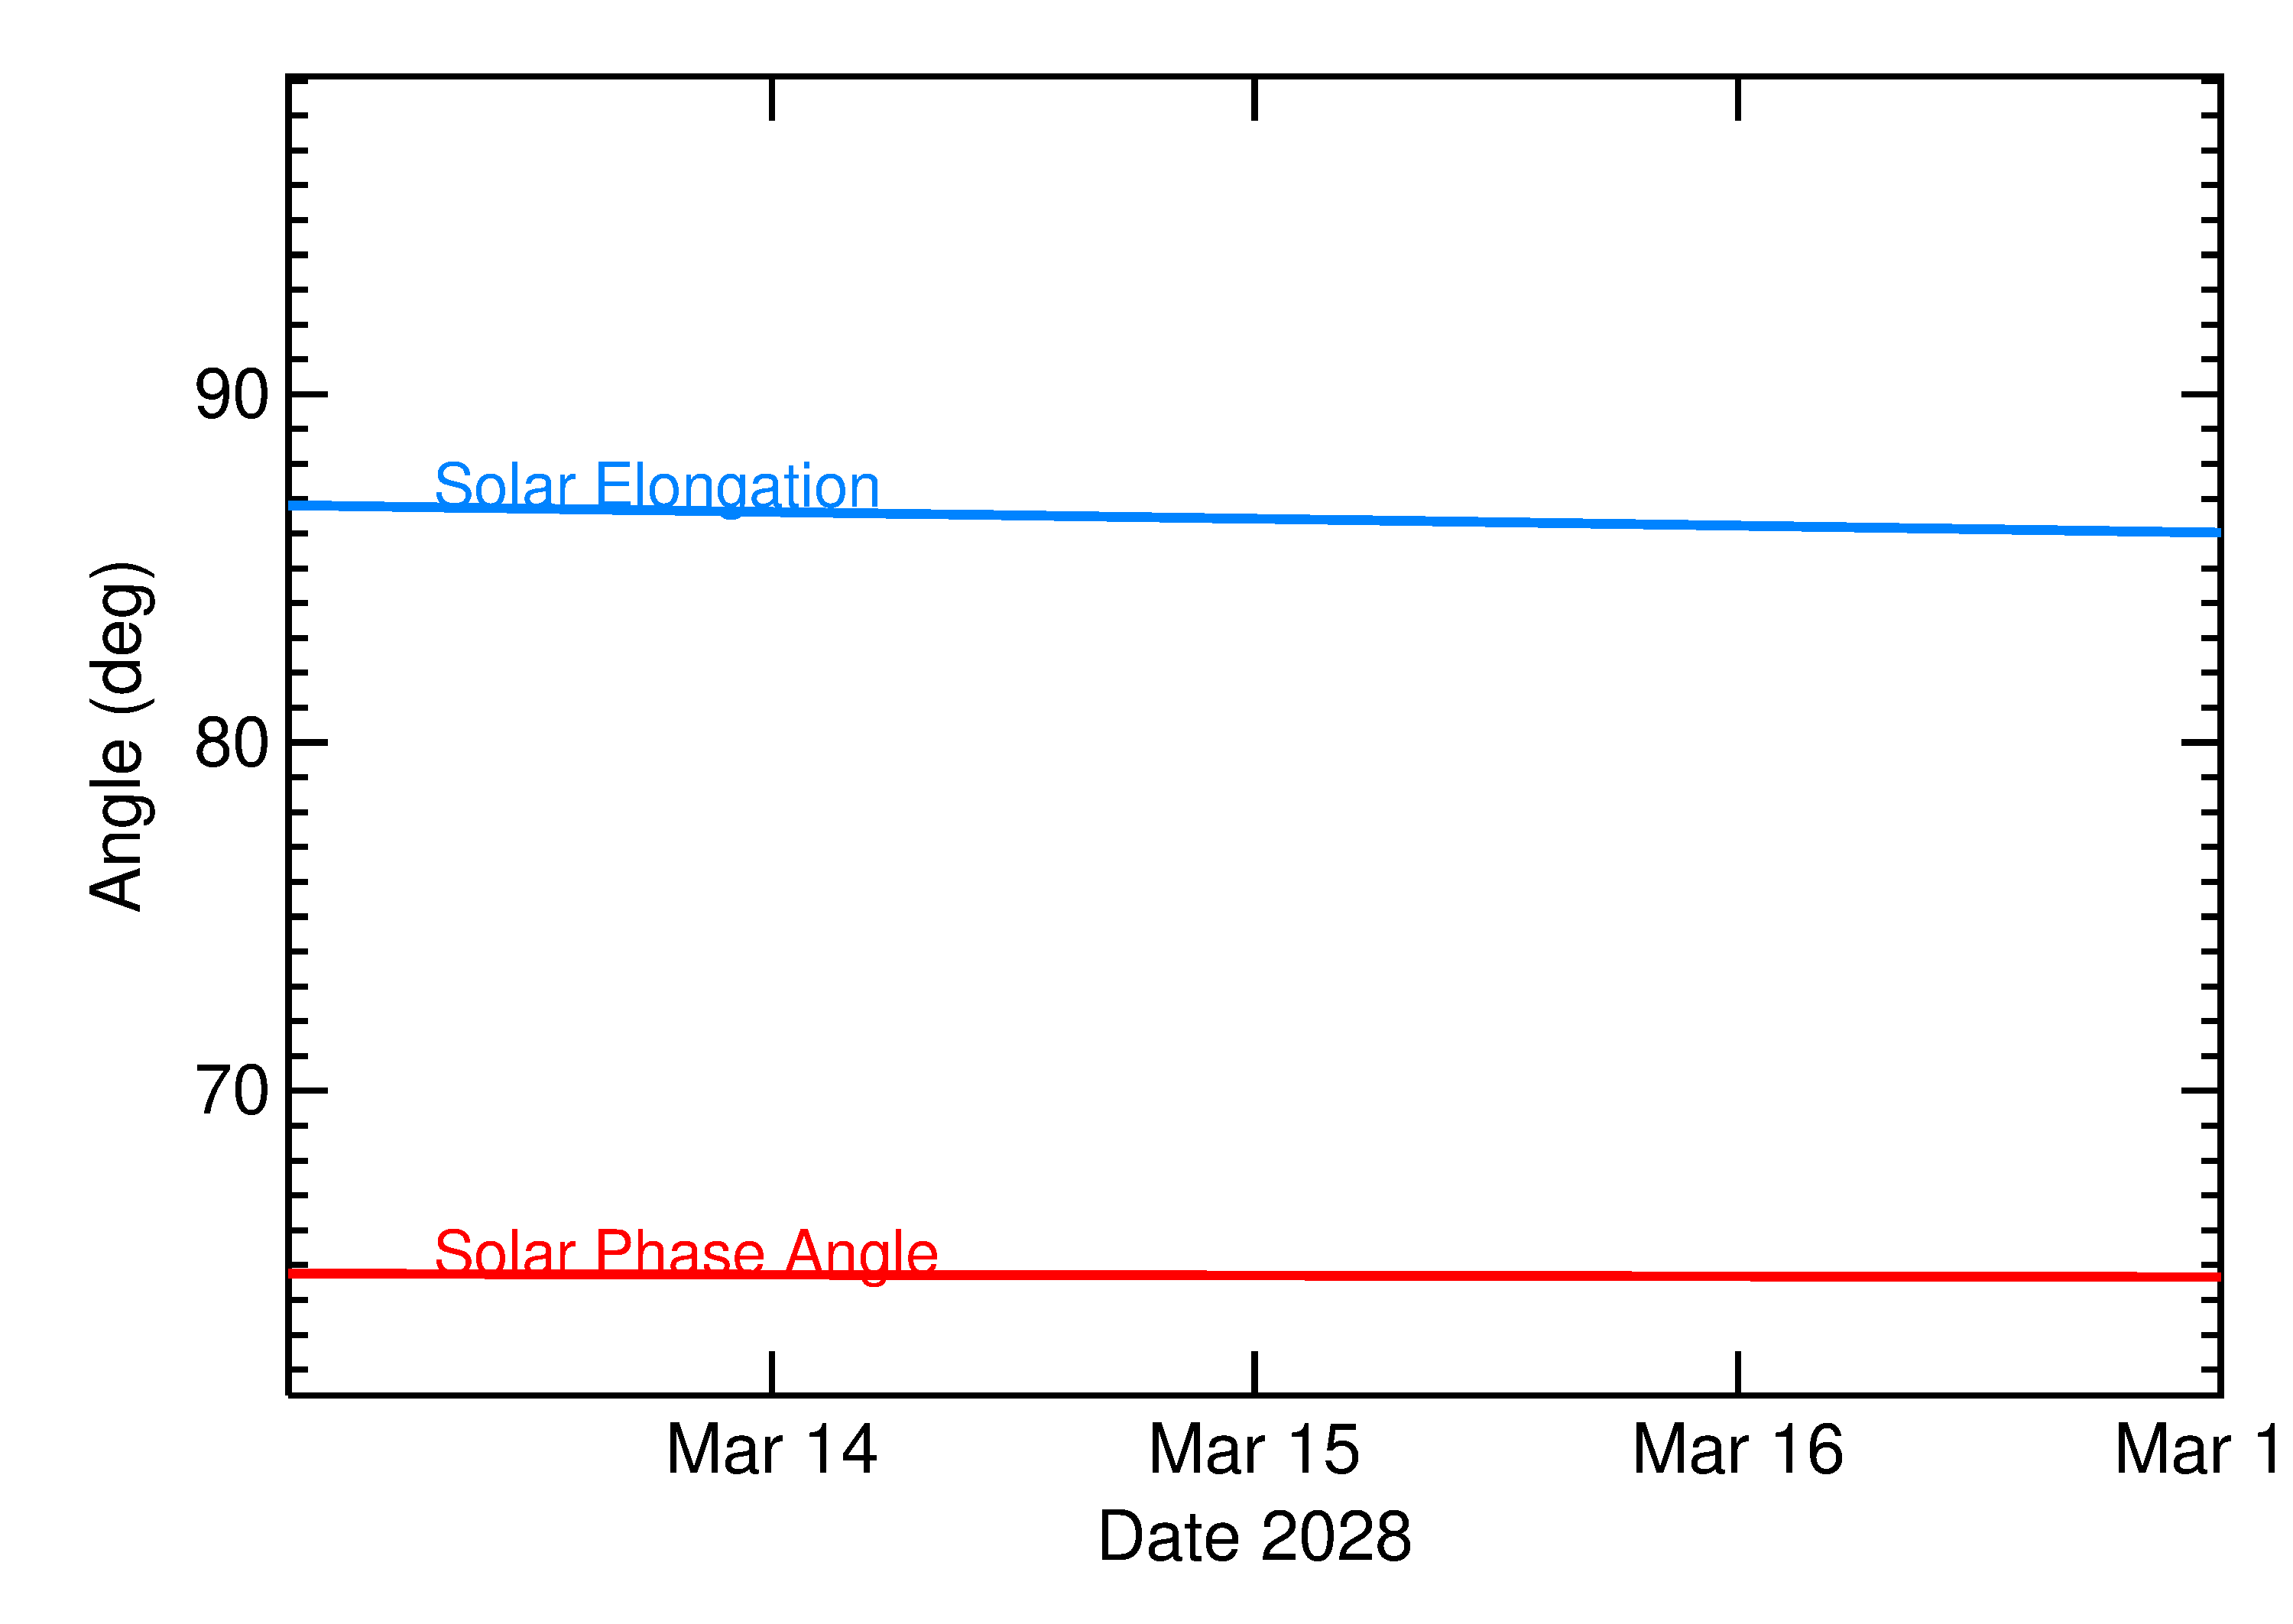
Solar Elongation and Solar Phase Angle
Expanded view of the angles around close approach: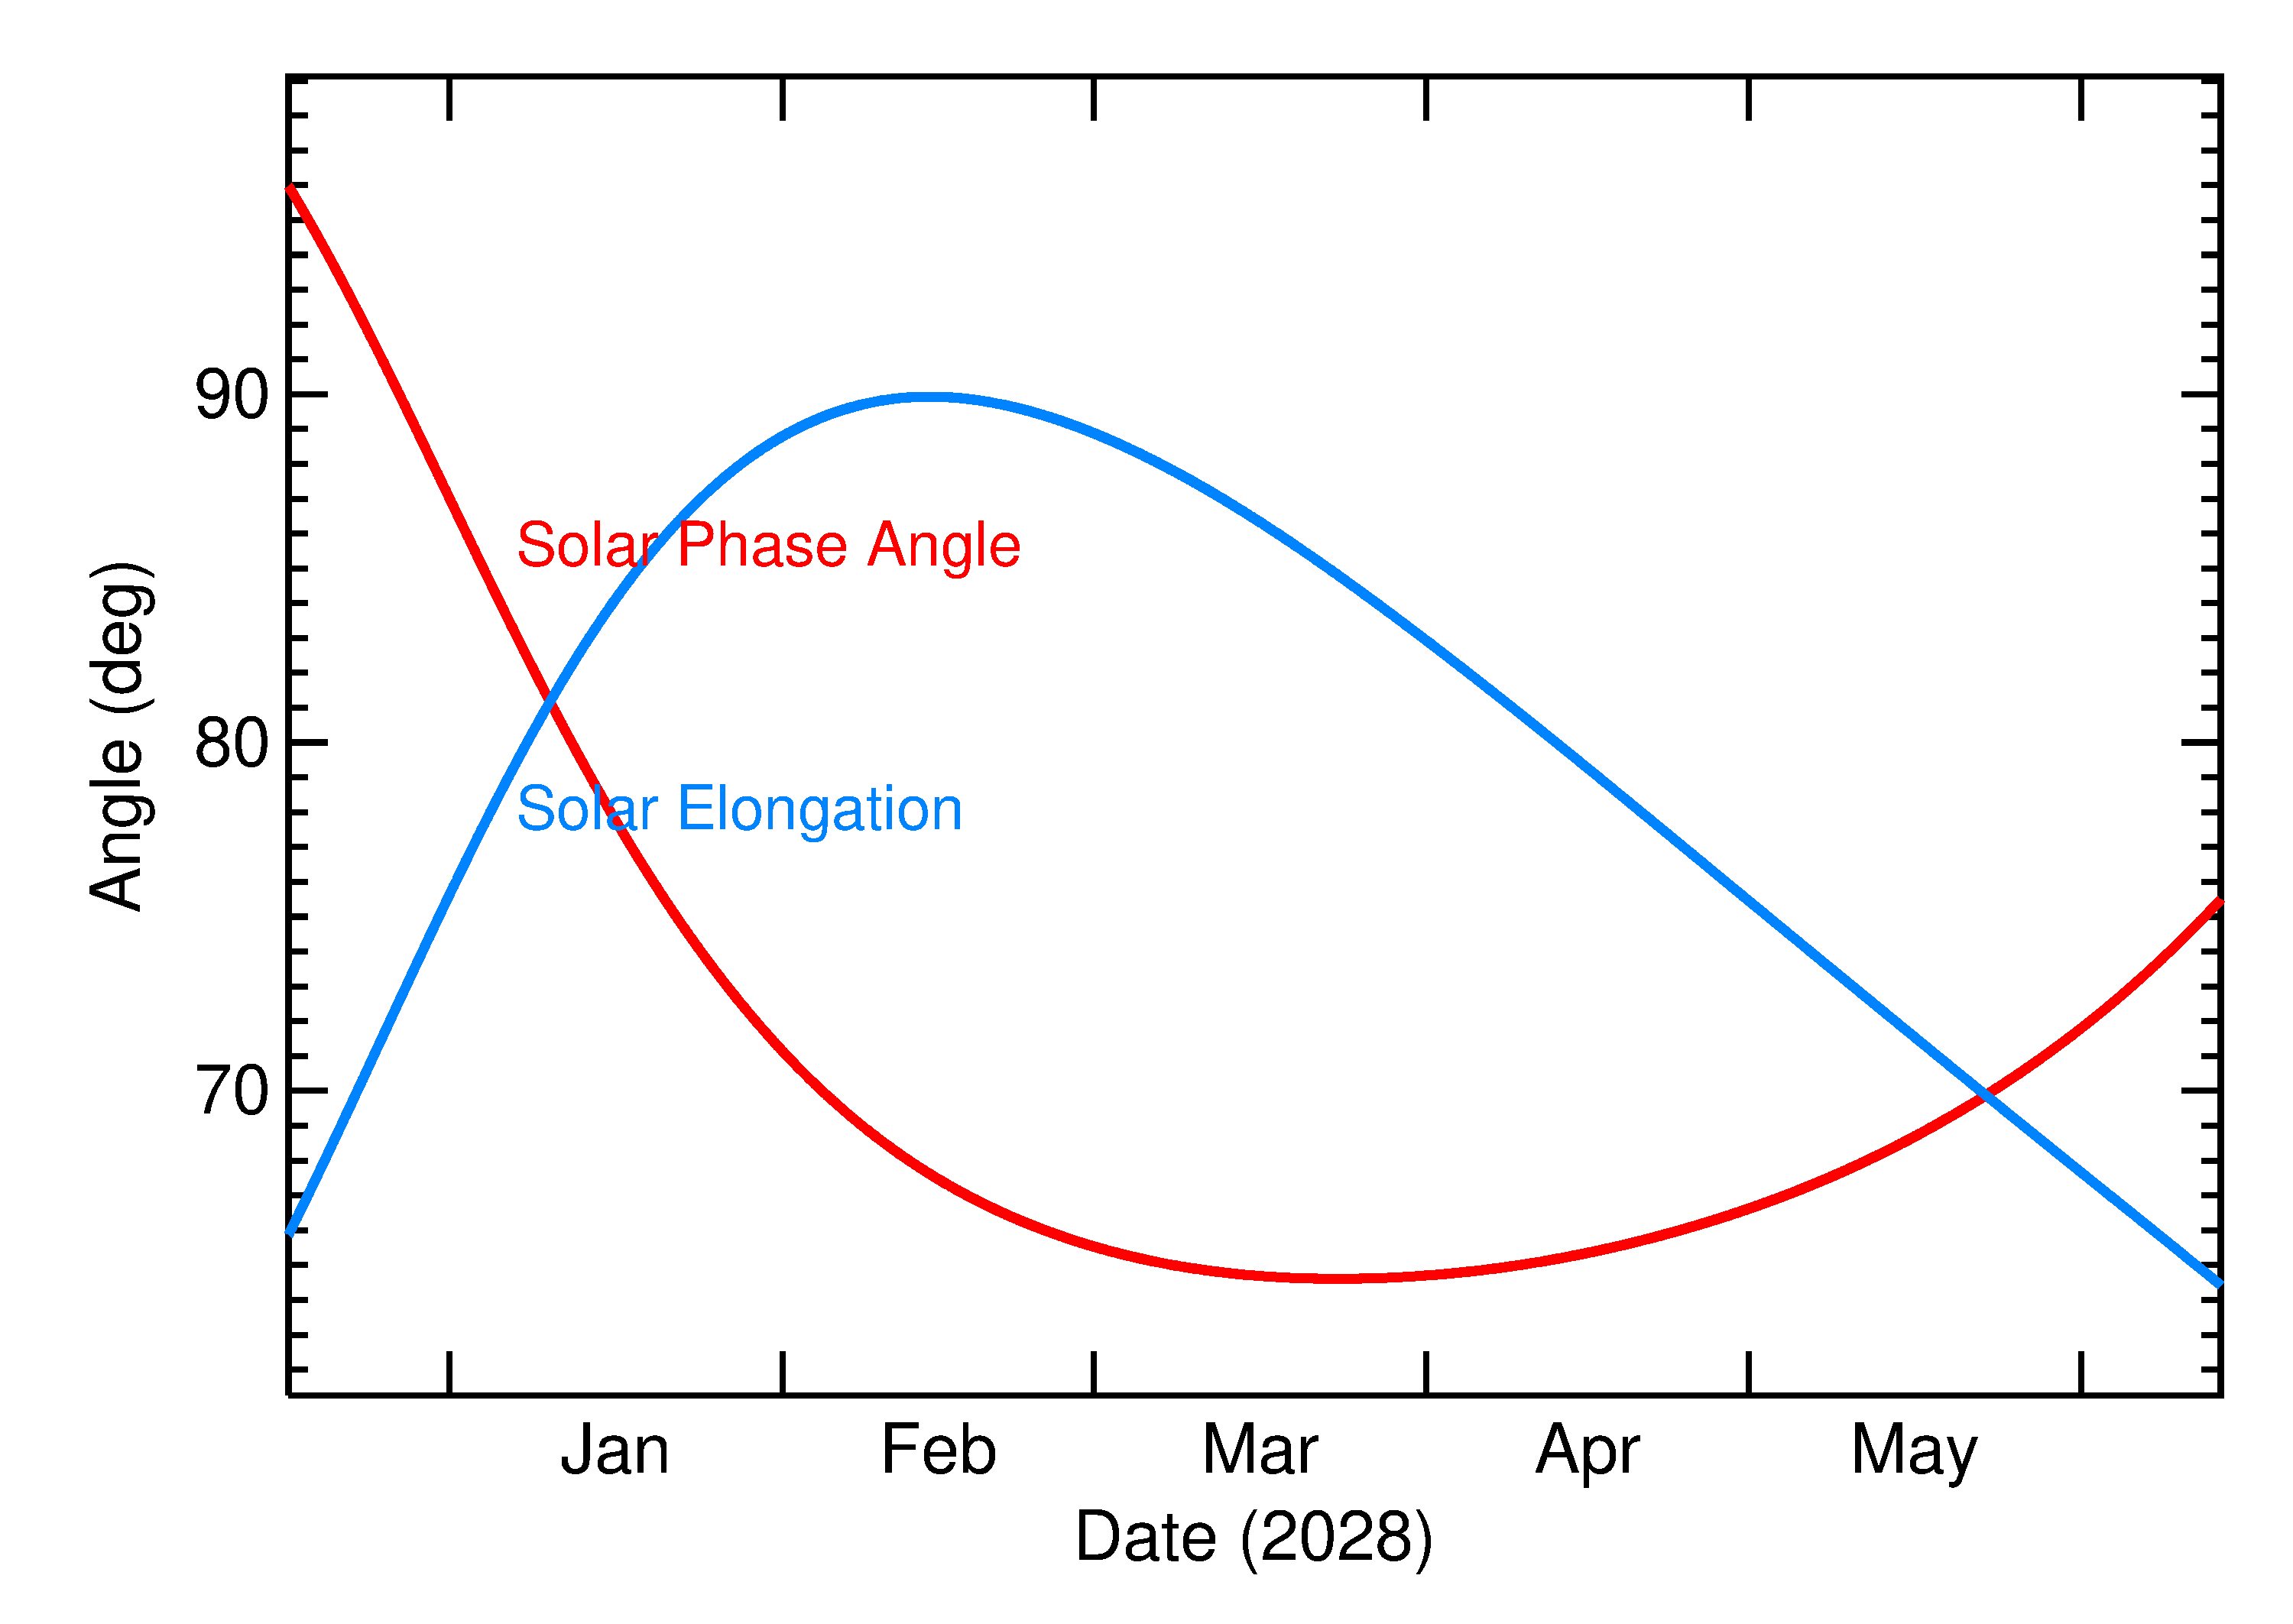
Rate of Motion
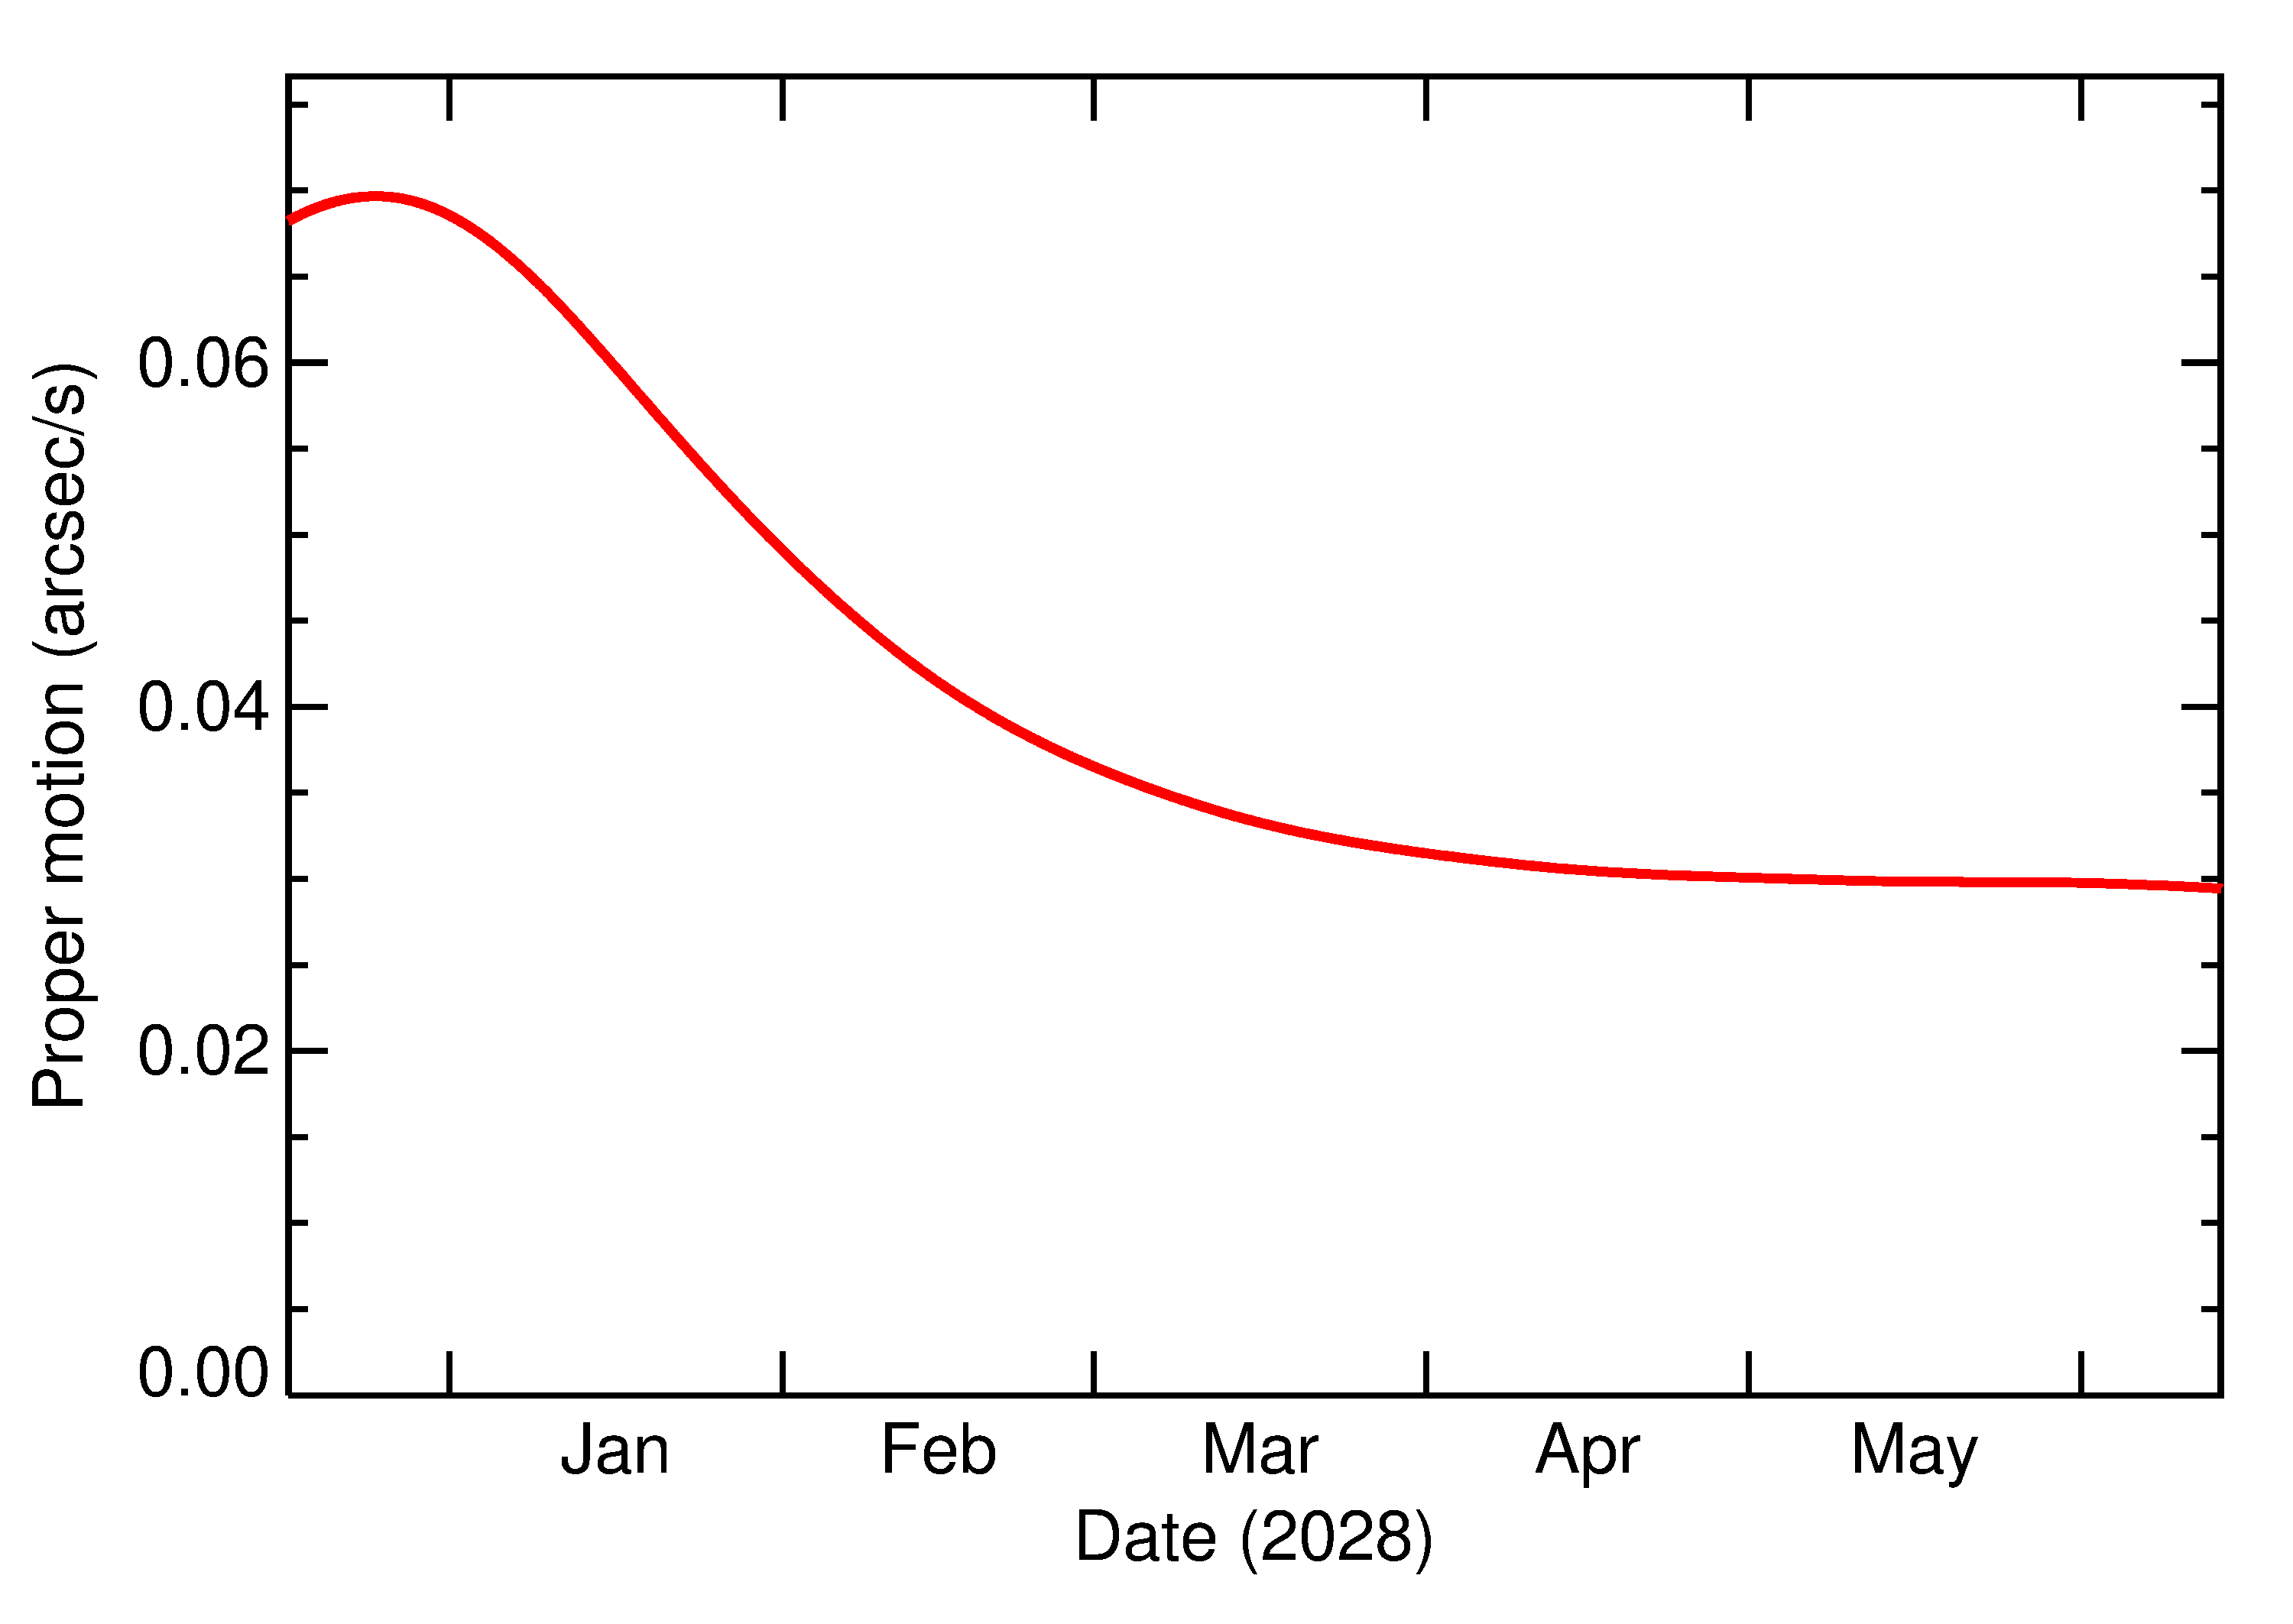
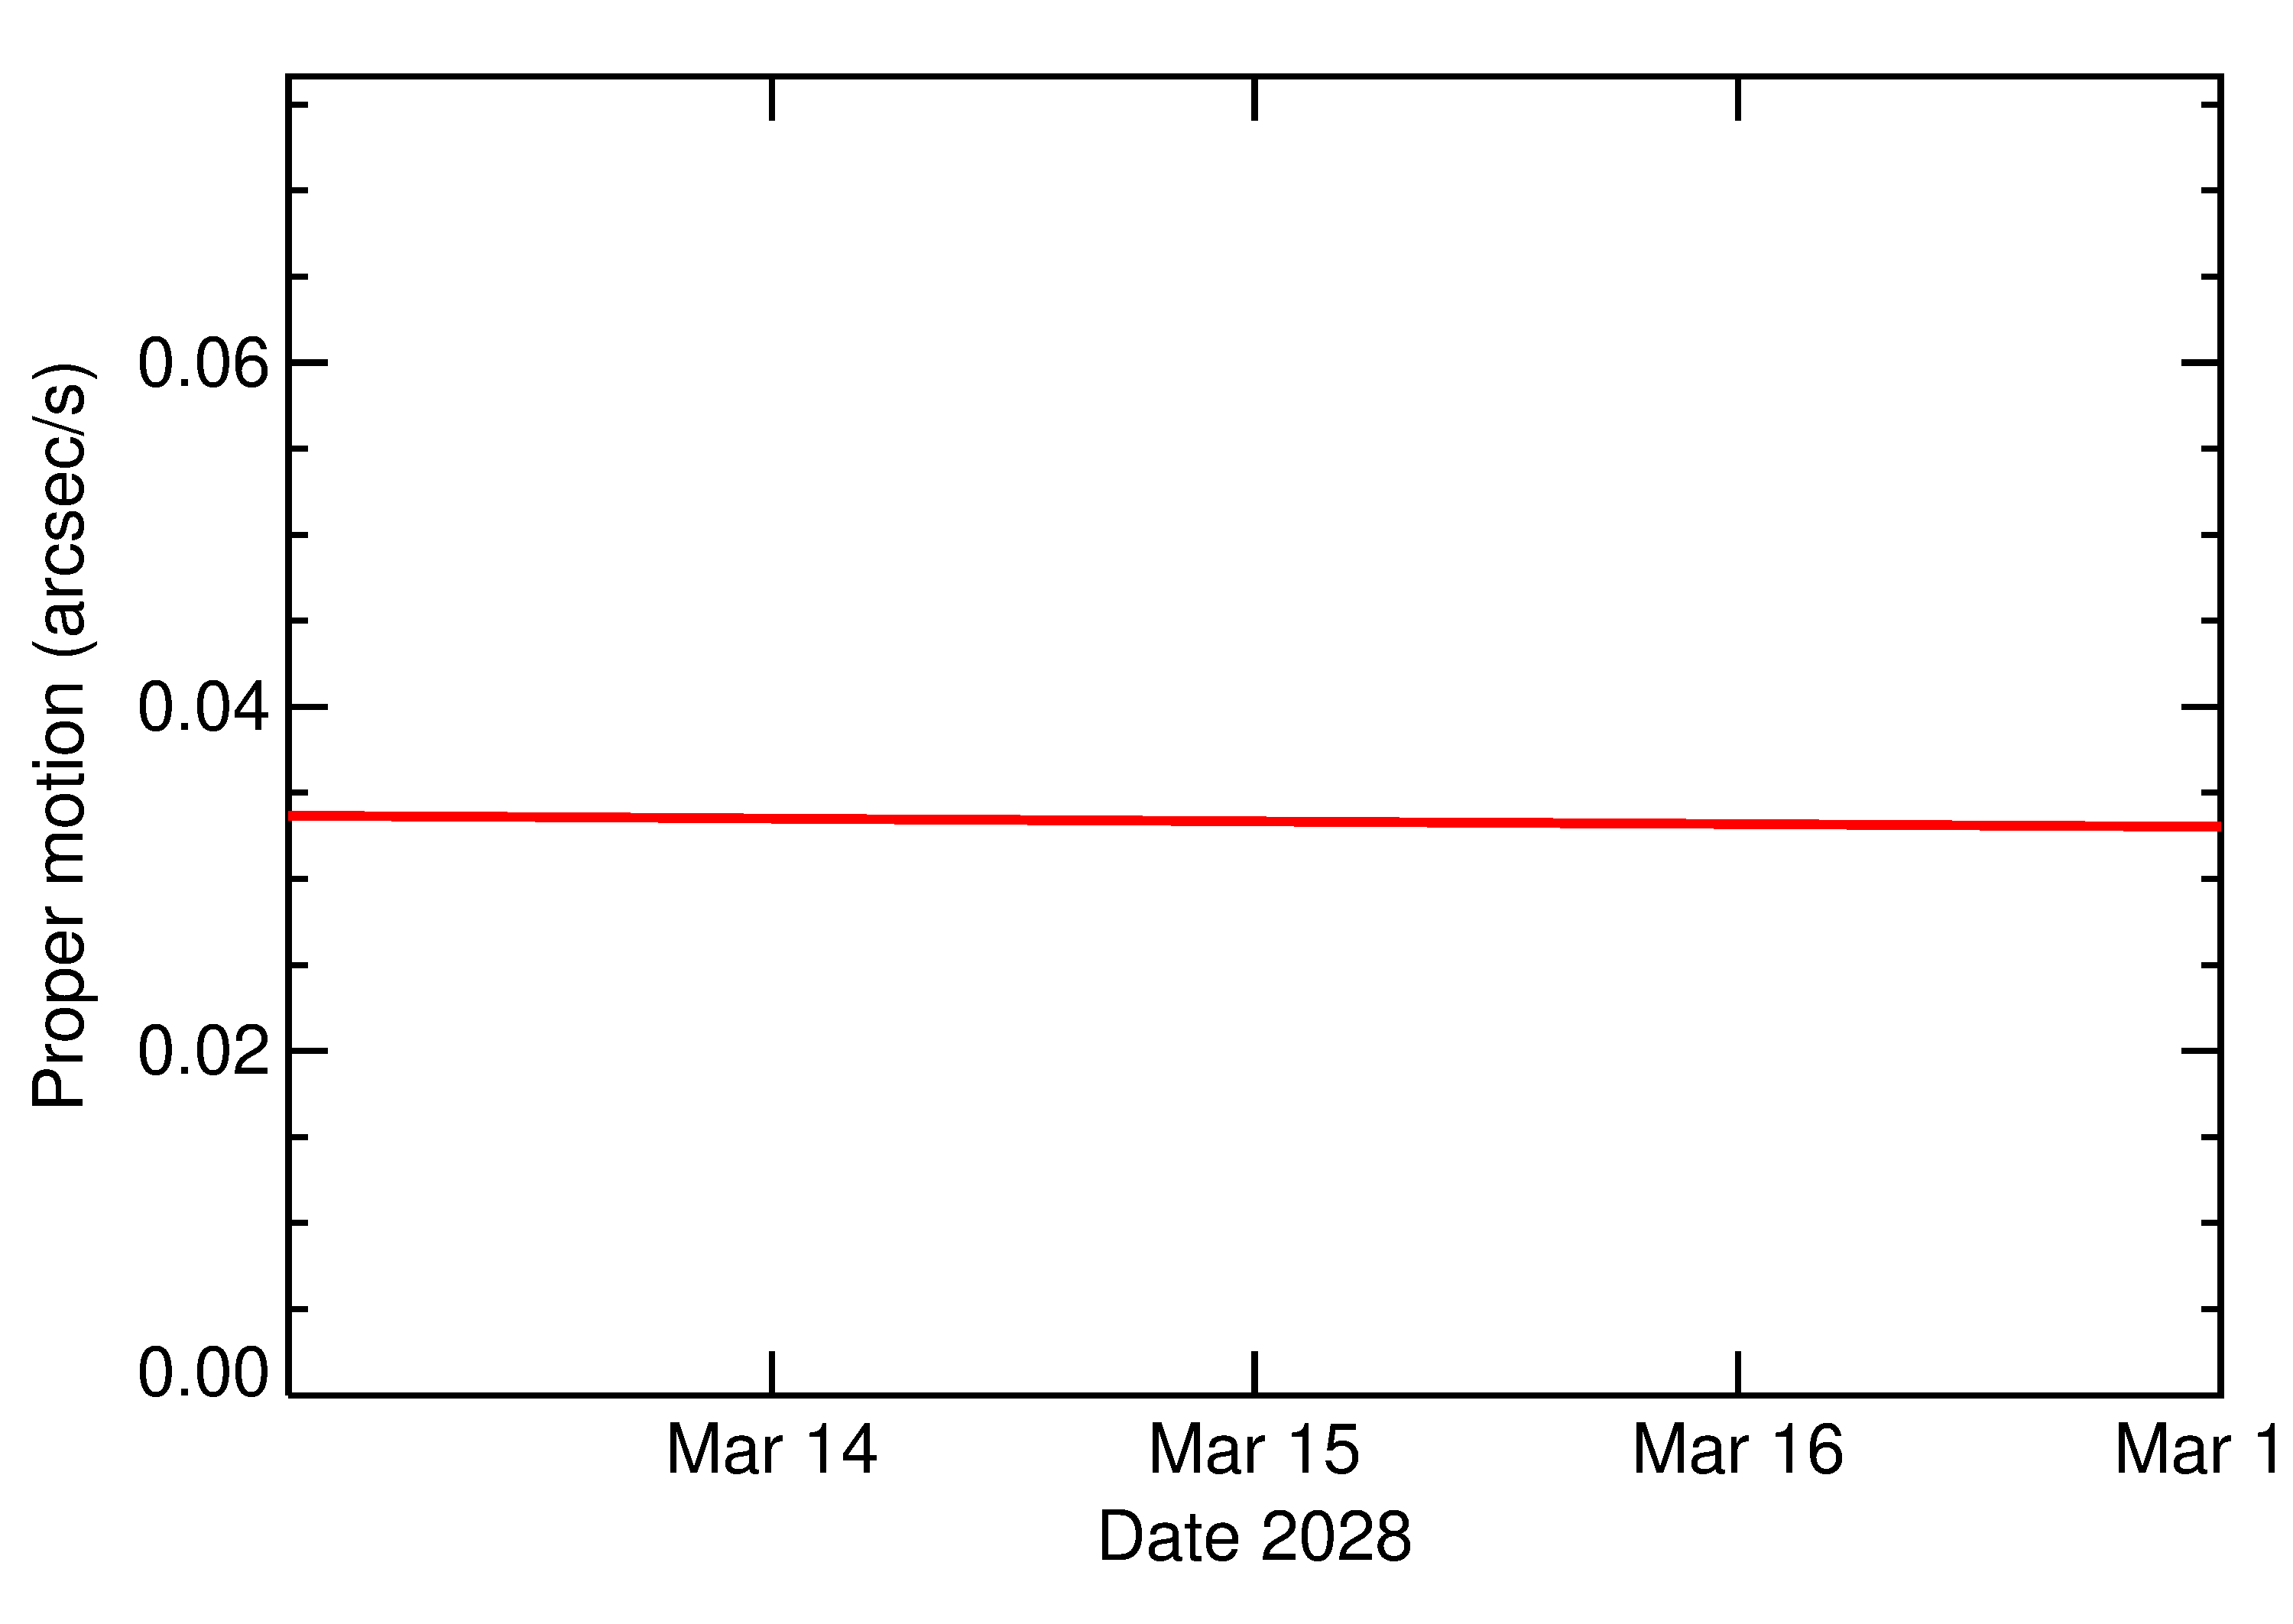
Apophis_rates.pdf
Apophis_rates2.pdf
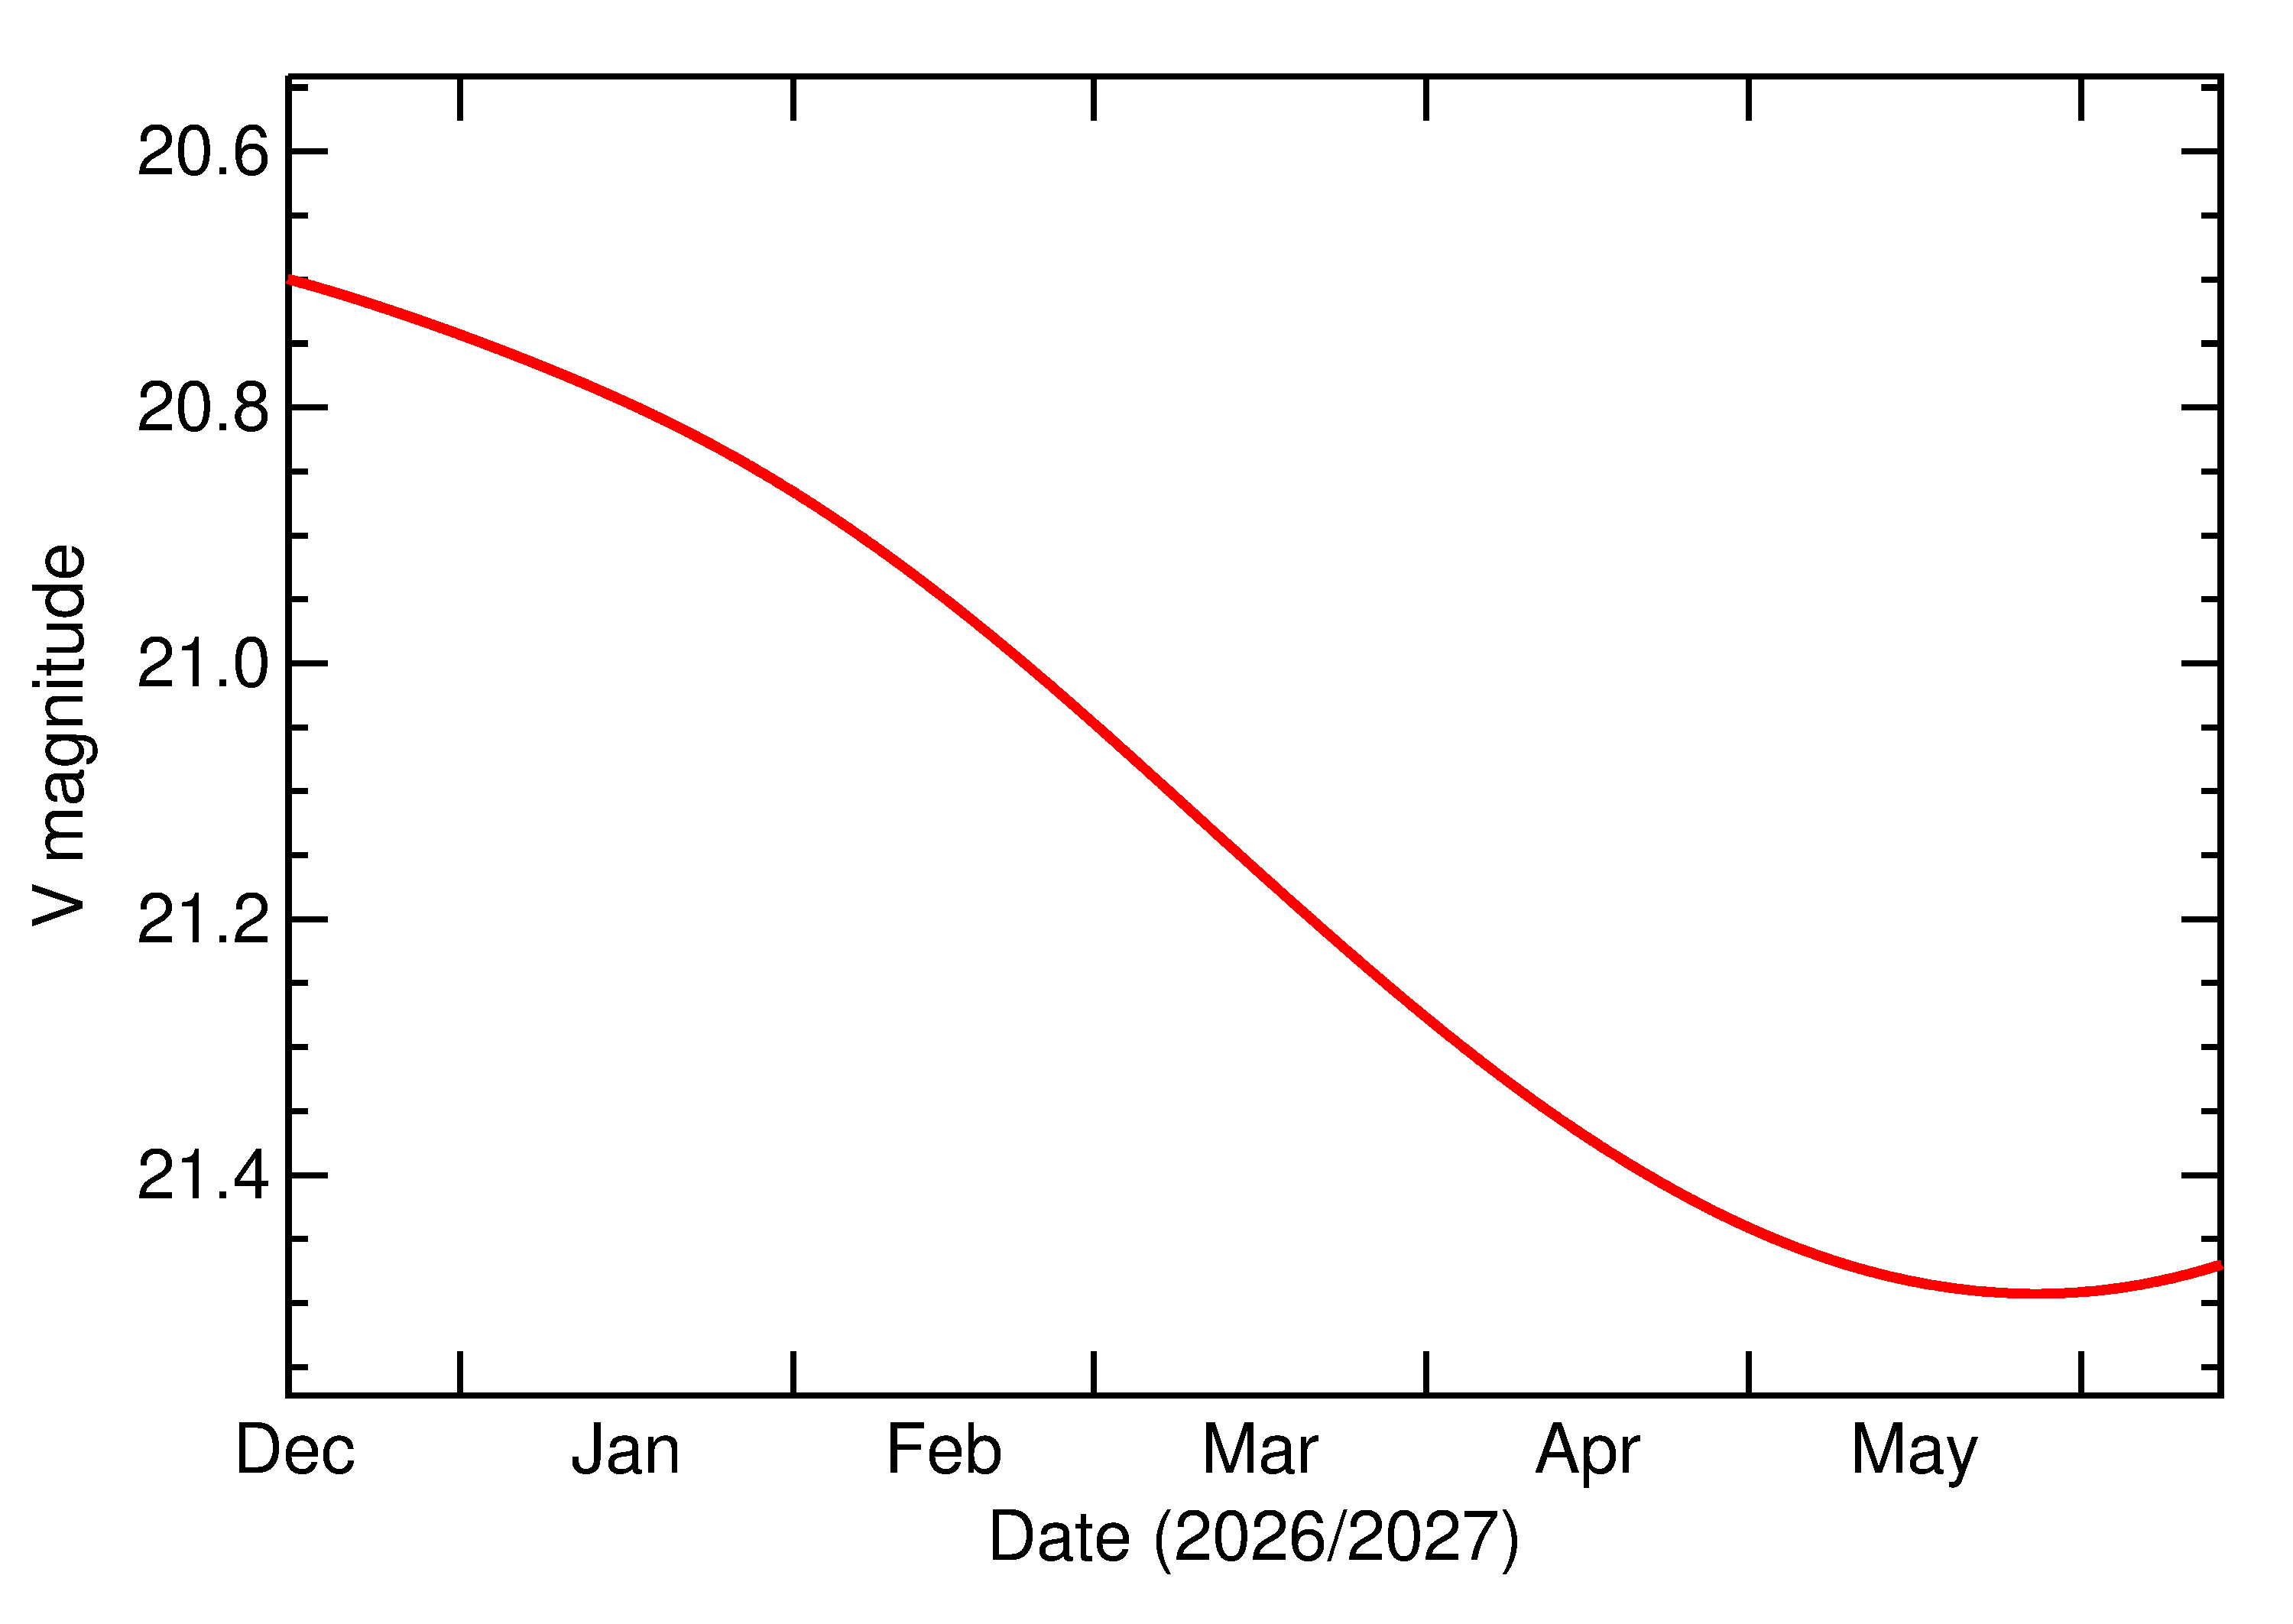
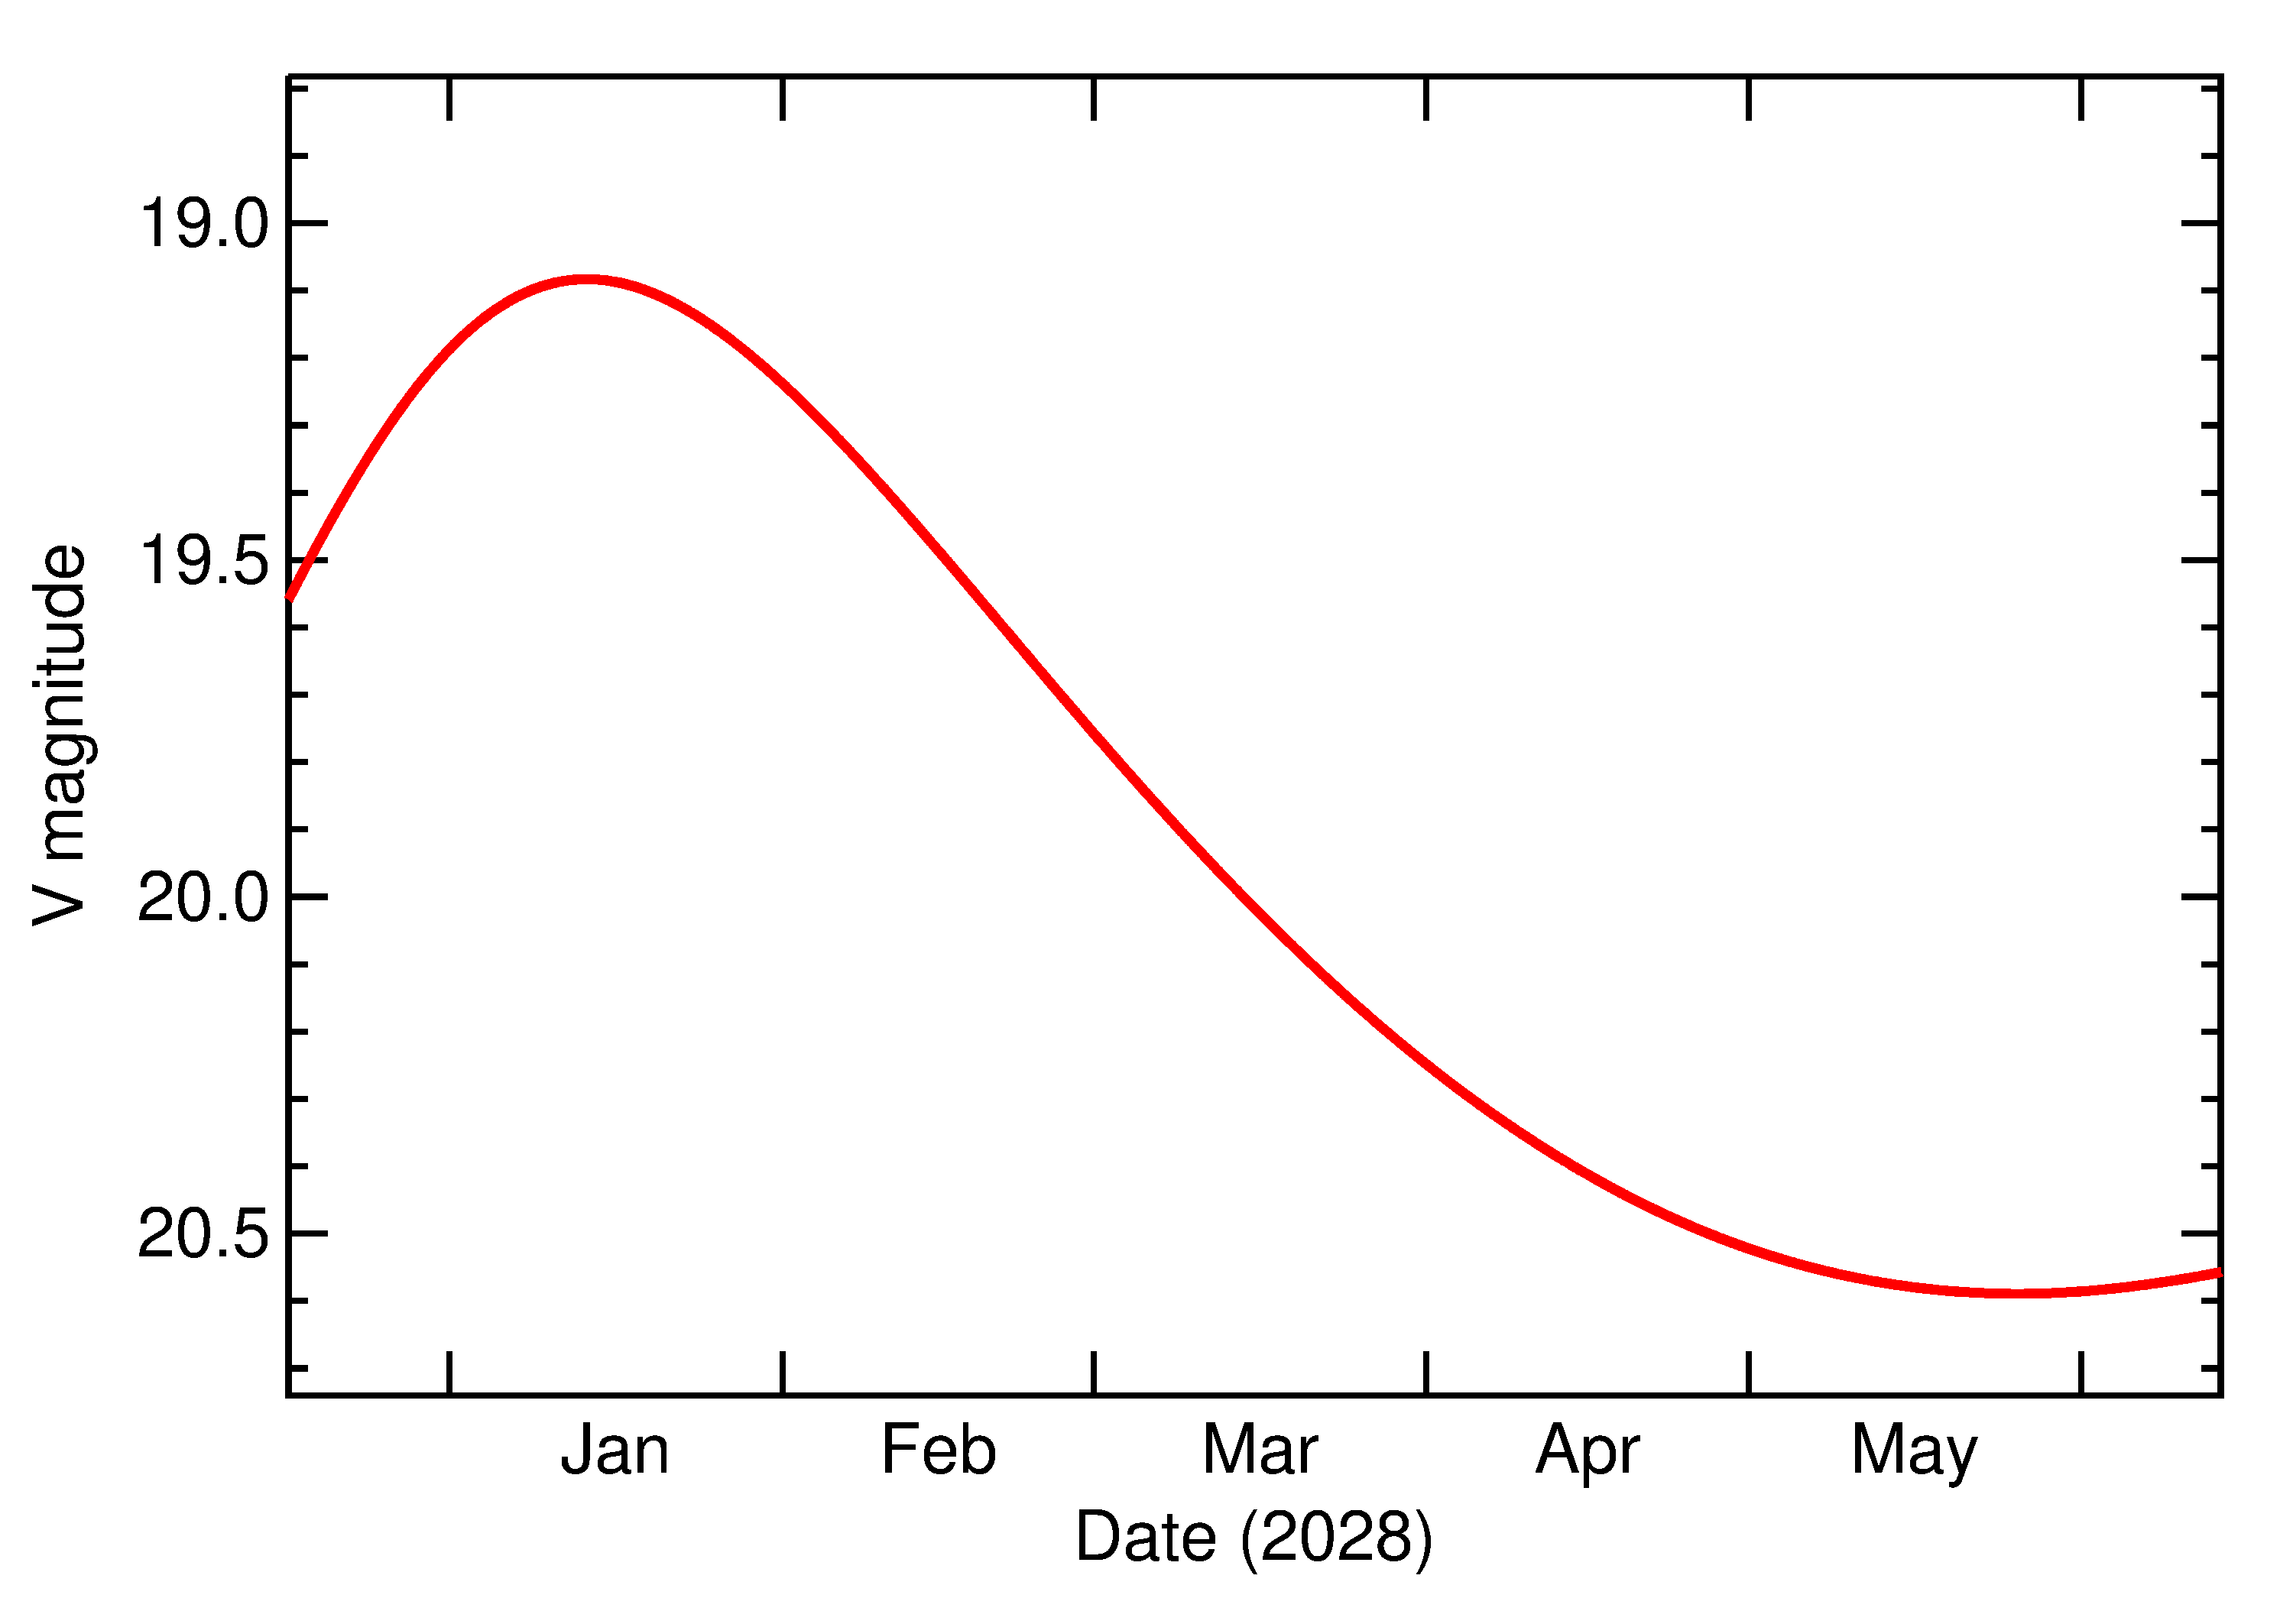
Predicted Brightness
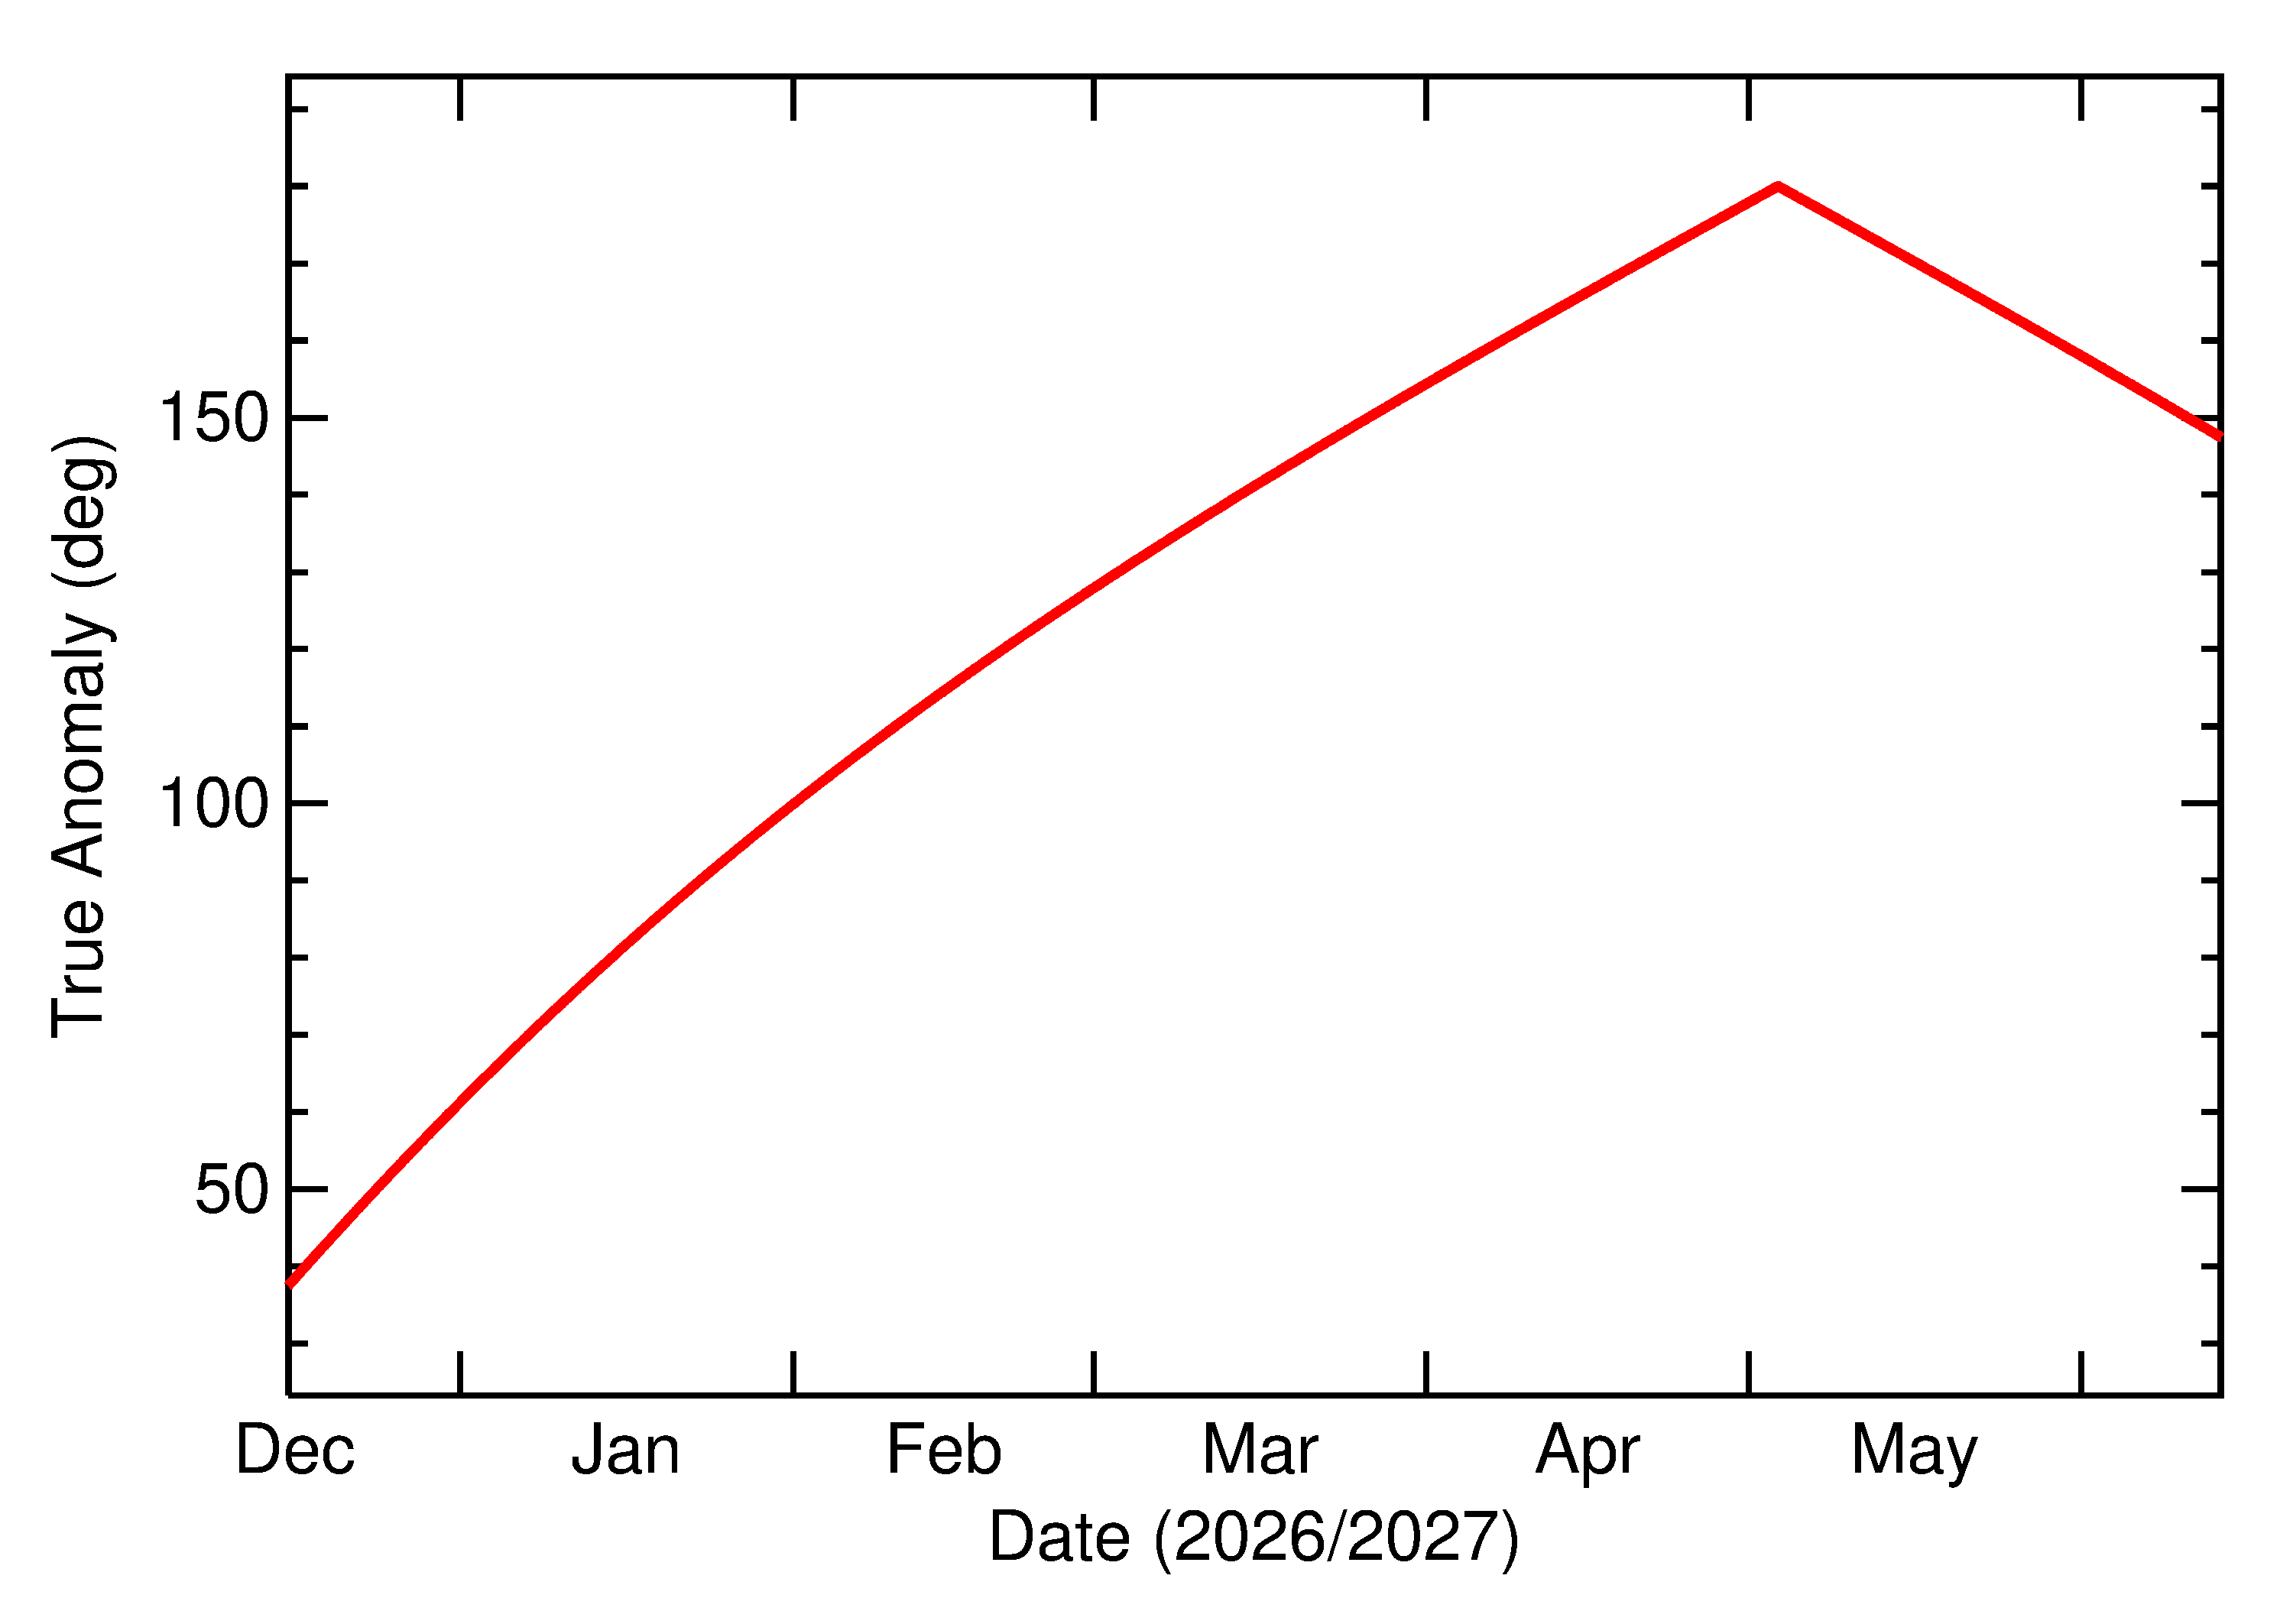
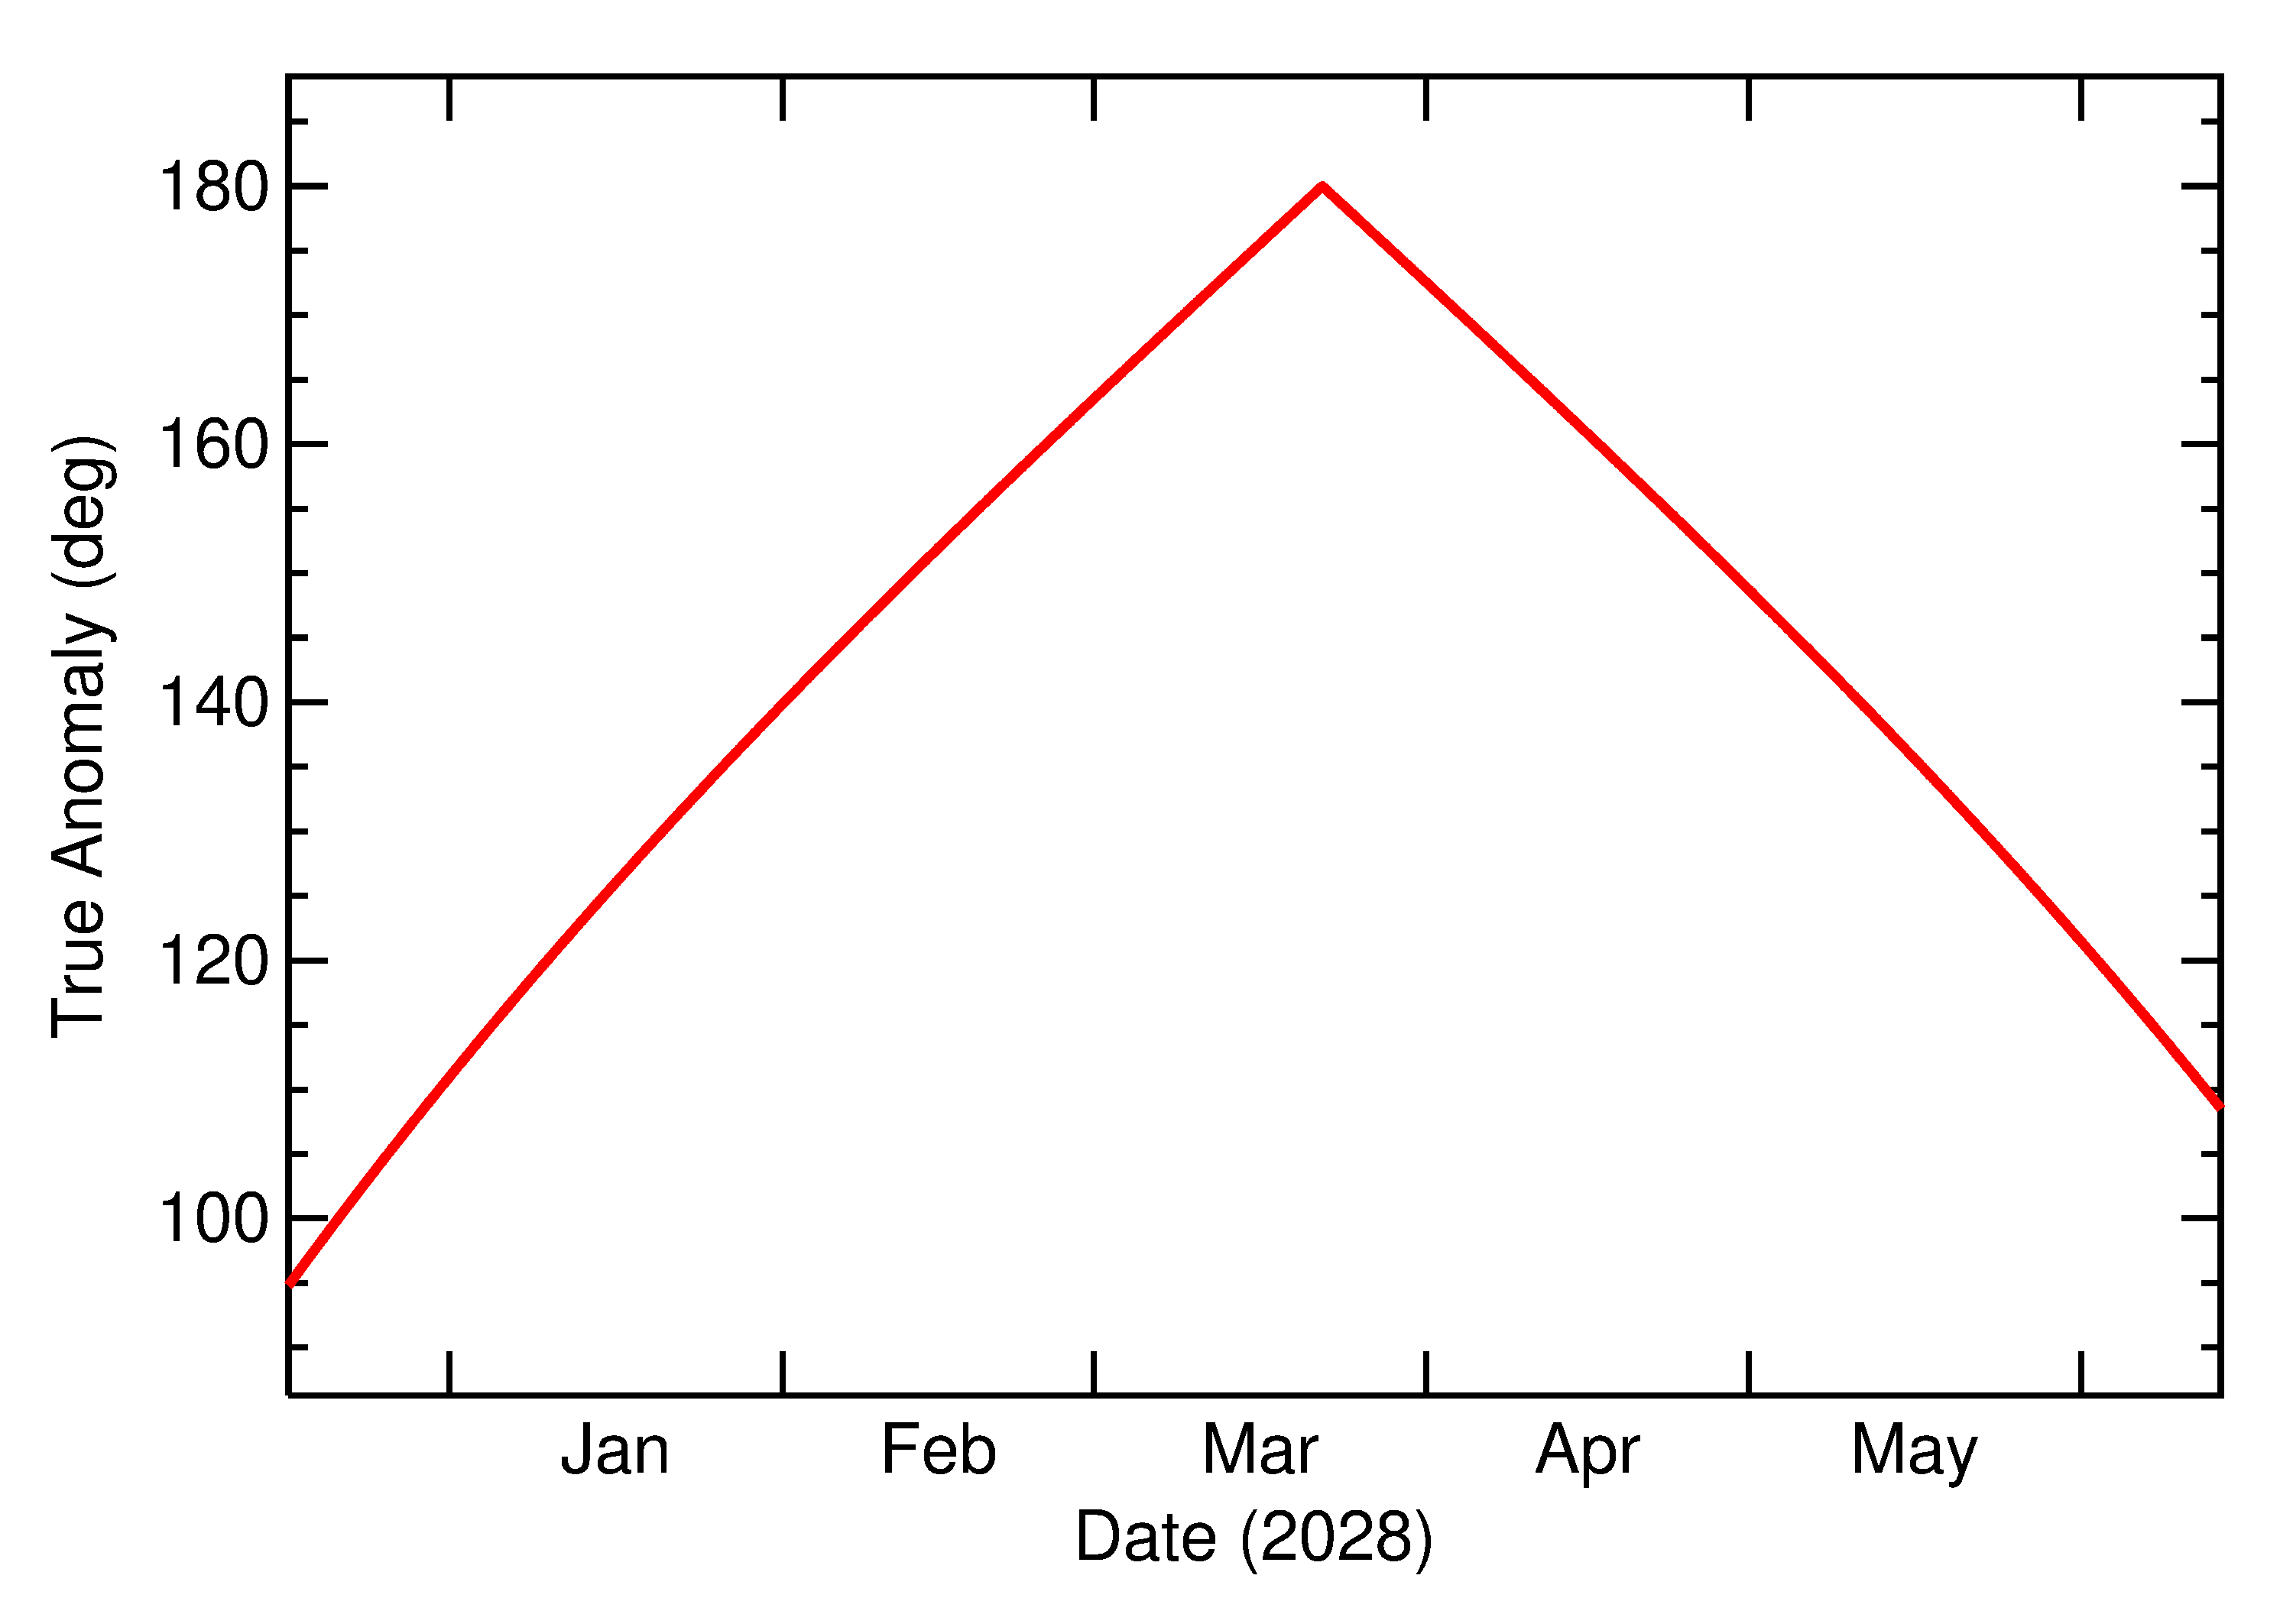
True Anomaly
Notice that the true anomaly may have a discontinuity at close approach, which is caused by the changes in the asteroid's orbit from the gravitational effects of the Earth.
Rise, set and visibility from different latitudes
The asteroid rises and sets at different times depending on the observer's latitude and longitude. The plots below provide information for approximating when the asteroid will be visible, and how long it will be observable from a given location on a given date.
Plots are given for latitude intervals of 5°, which is usually close enough for general planning purposes. Rise and set times are given in UTC for 0° longitude. For other latitudes, these times will be approximate to the local time, which should again be sufficient for basic planning purposes. Note, however, that there will be an offset (typically < 1/2 hr) for different longitudes, so if more accuracy is needed, then you should obtain a more detailed ephemeris.
How to read these plots
We provide a more detailed description of the Rise/Set and visibility plots, and an example of how to read the information here (PDF).
Asteroid visibility (TimeUp) and Rise/Set plots
If there is another major observatory for which you'd like to see details, please let know.
| 2028 Encounter | ||
|---|---|---|
| Goldstone (+35.4) | Timeup | Rise/Set |
| DCT (+34.7) | Timeup | Rise/Set |
| Spacewatch (+32) | Timeup | Rise/Set |
| La Palma (+28.8) | Timeup | Rise/Set |
| IRTF (+19.8) | Timeup | Rise/Set |
| Arecibo (+18.4) | Timeup | Rise/Set |
| La Silla (-29) | Timeup | Rise/Set |
| CTIO (-30.2) | Timeup | Rise/Set |
| Sutherland (-32.4) | Timeup | Rise/Set |
2029
Observing Geometry for the 2029 Apparition
The plots presented here are for general planning purposes. If you need more detailed values for the different geometric conditions, use the JPL Horizons routines to compute the values for your specific situation.
Geometry was computed using the orbital solution JPL#199.
Geometry Data File
The geometric data plotted below is included in ASCII format in this Data File.
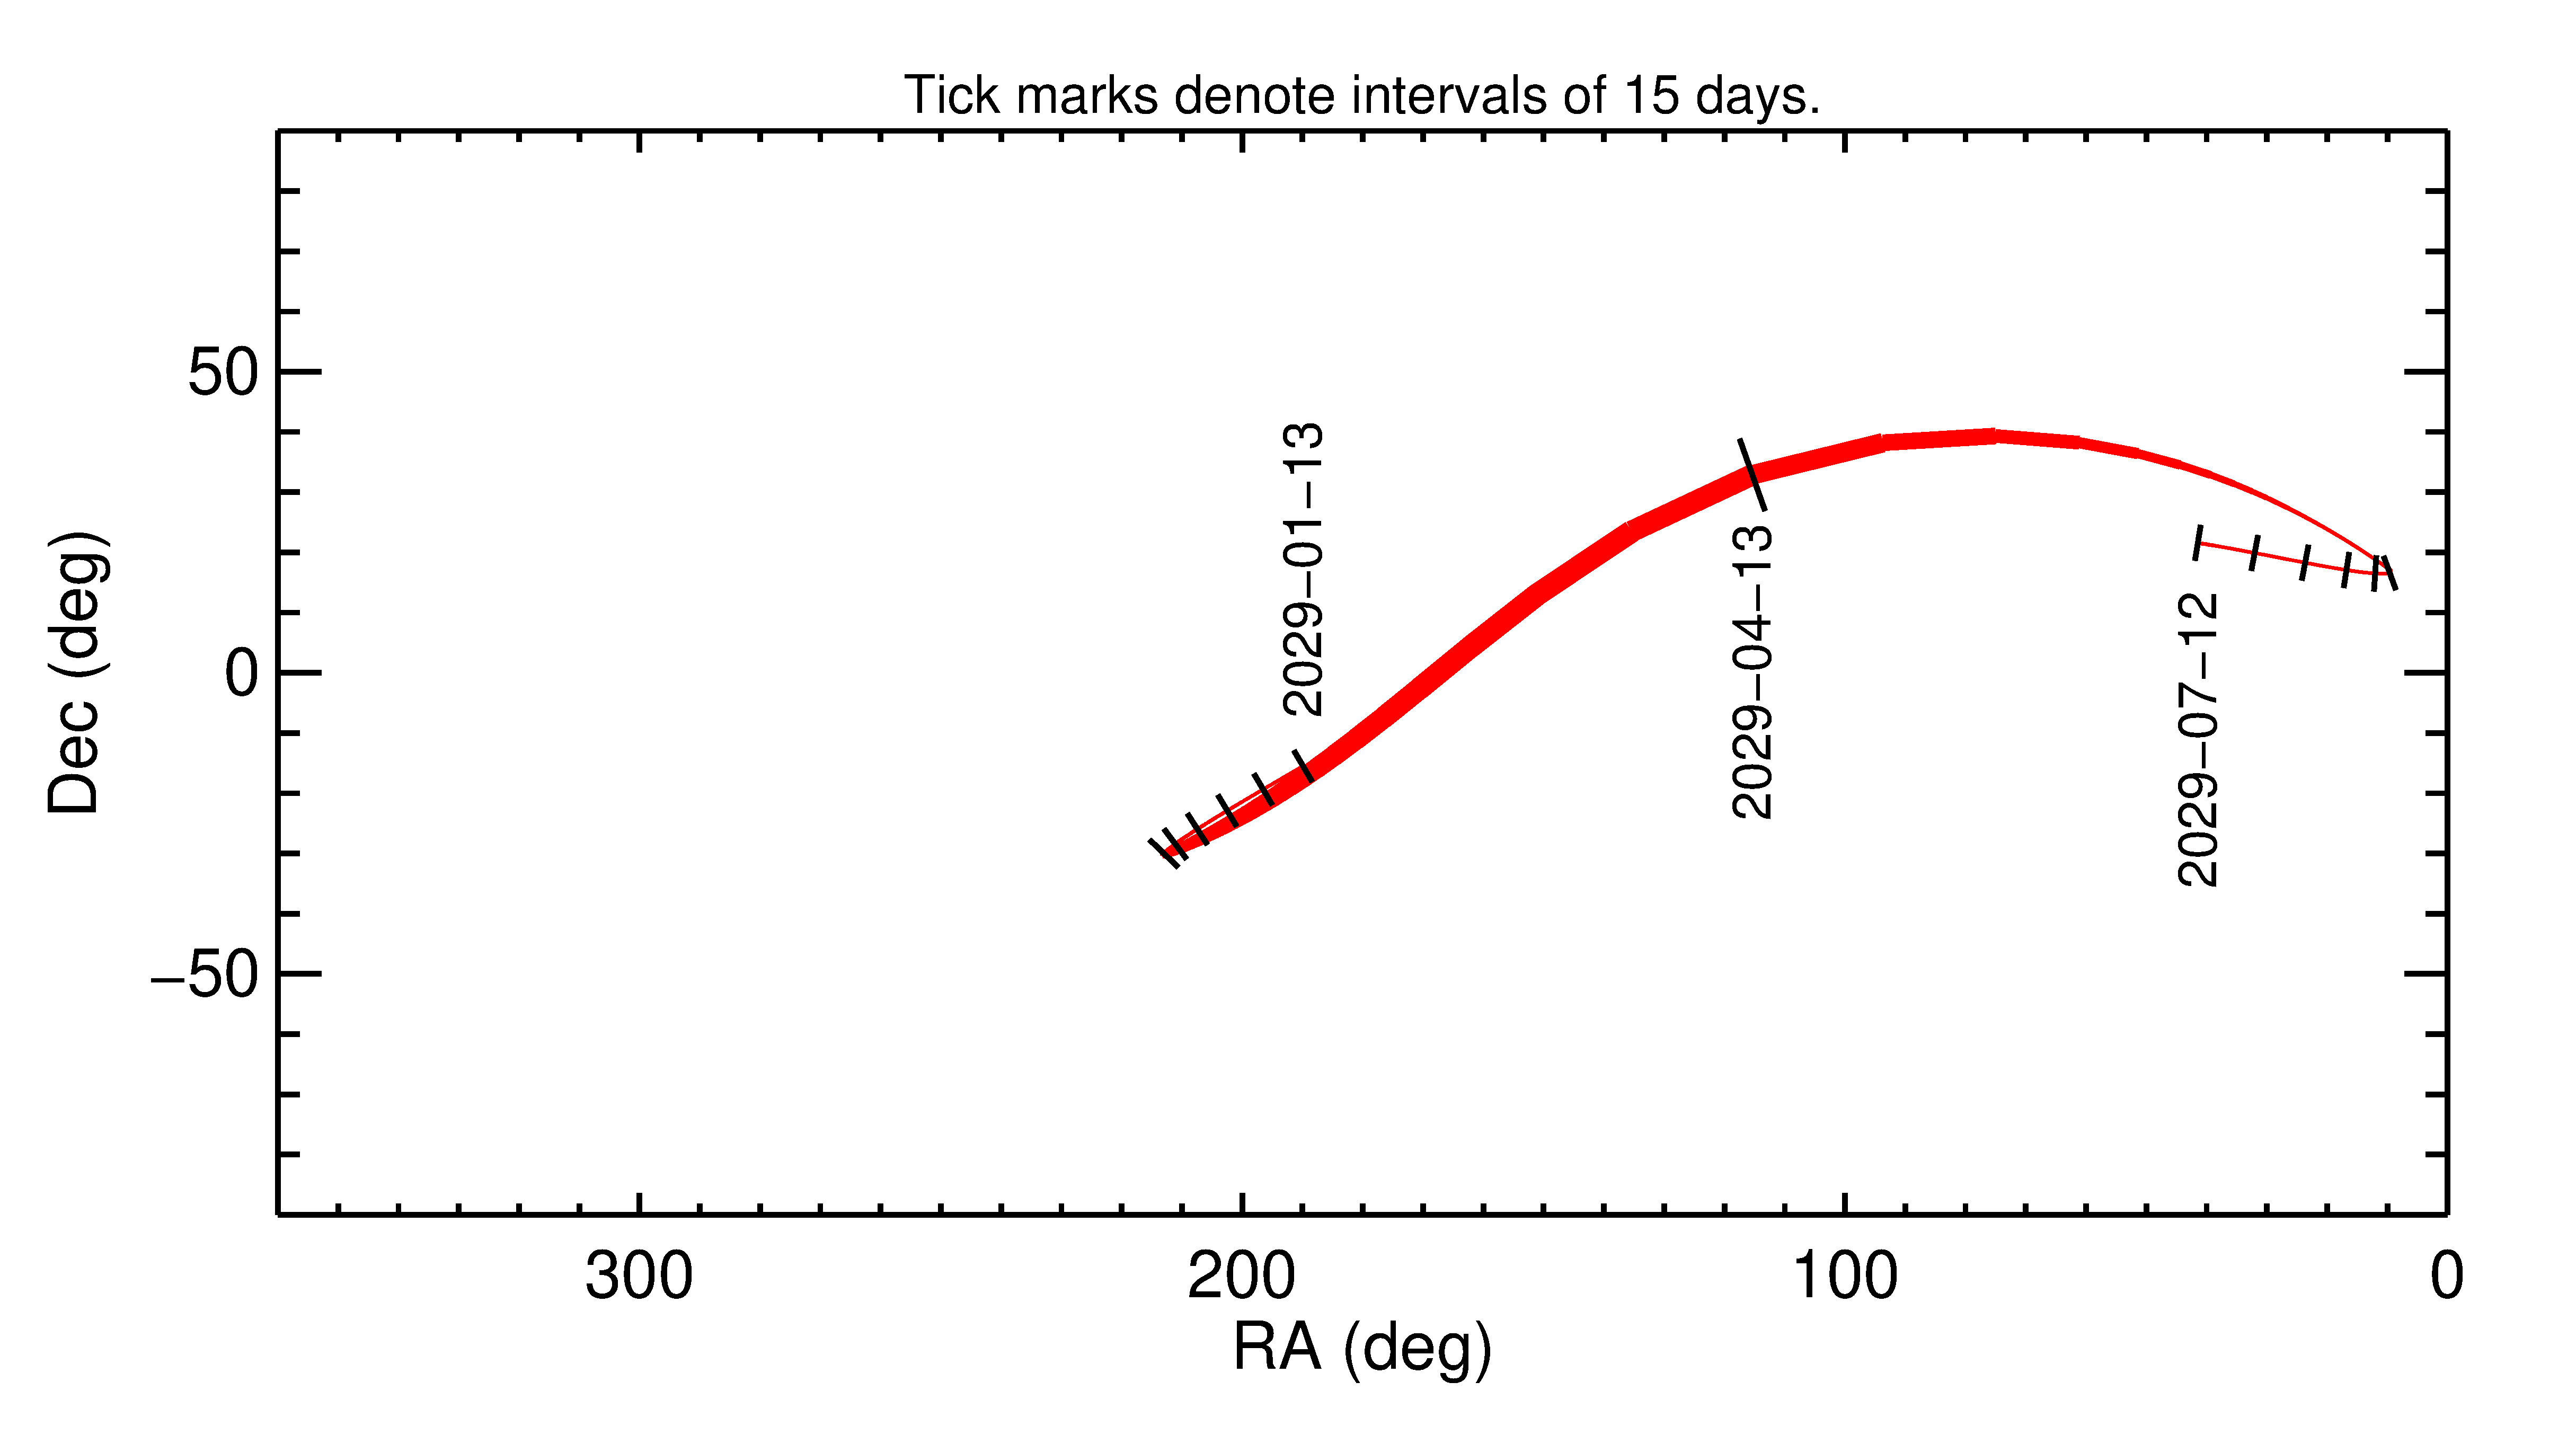
Right Ascension and Declination
Note that the width of the line reflects the objects estimated brightness, which is plotted below.
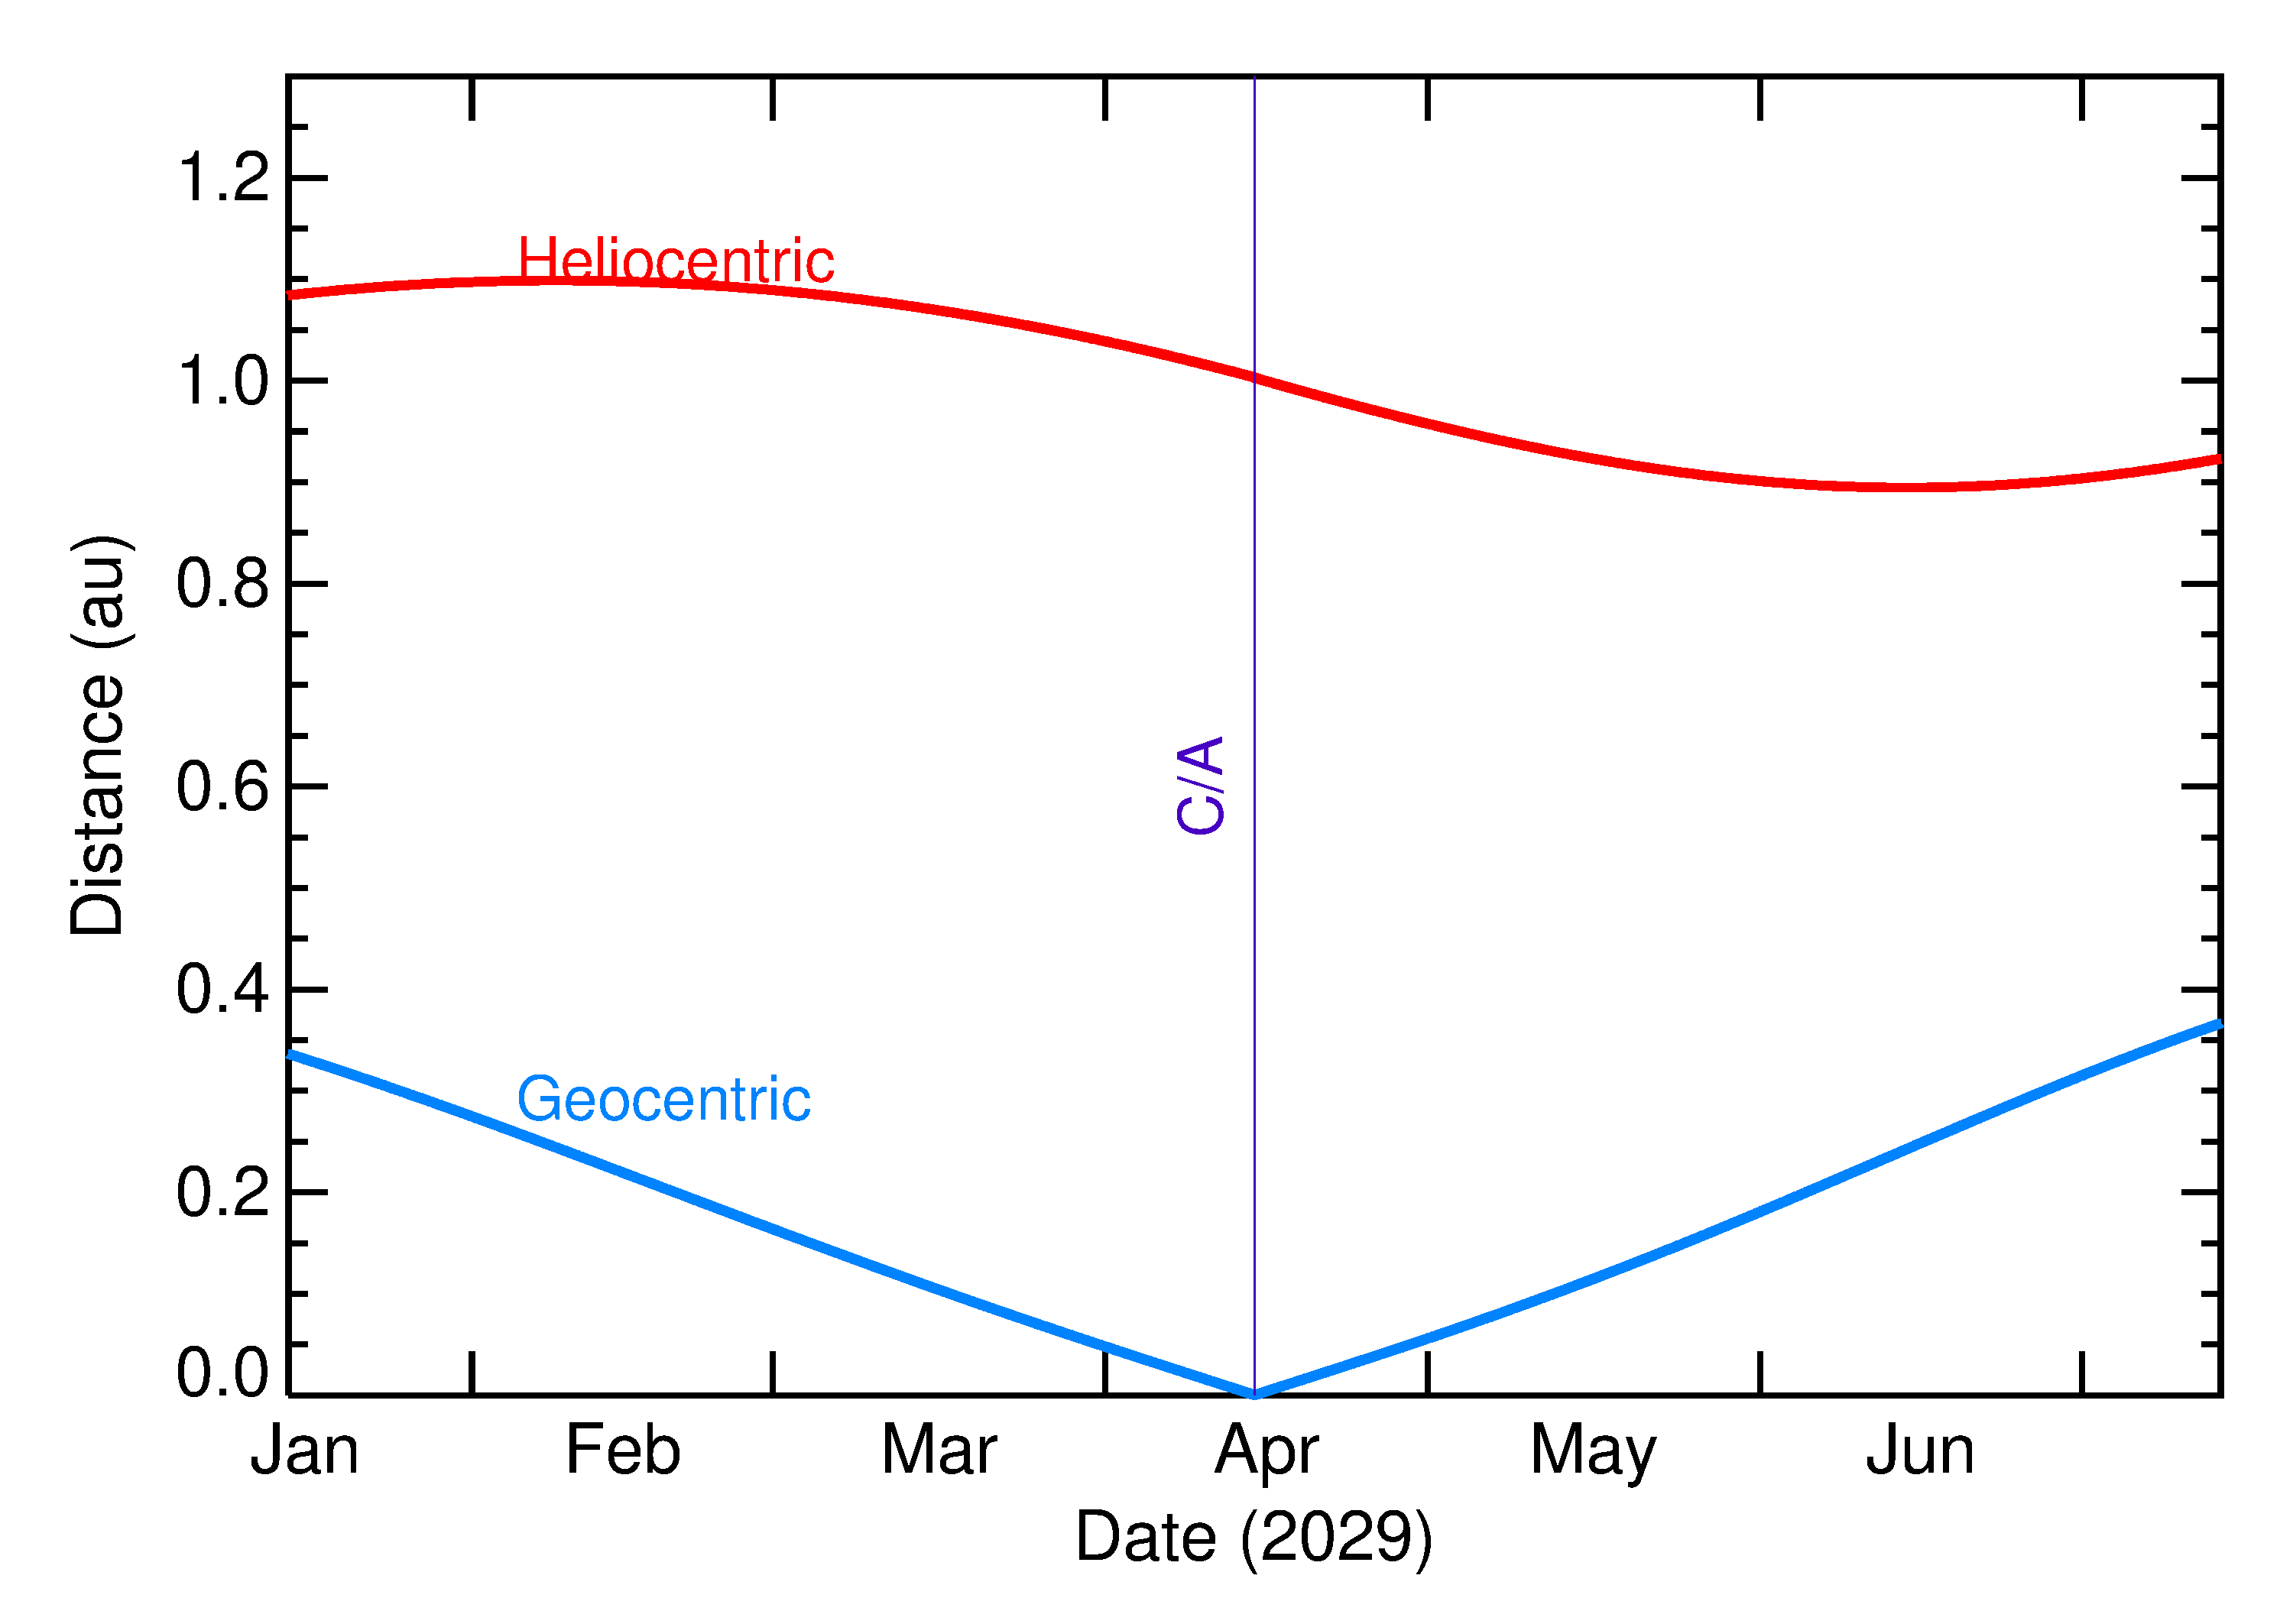
Heliocentric and Geocentric Distances
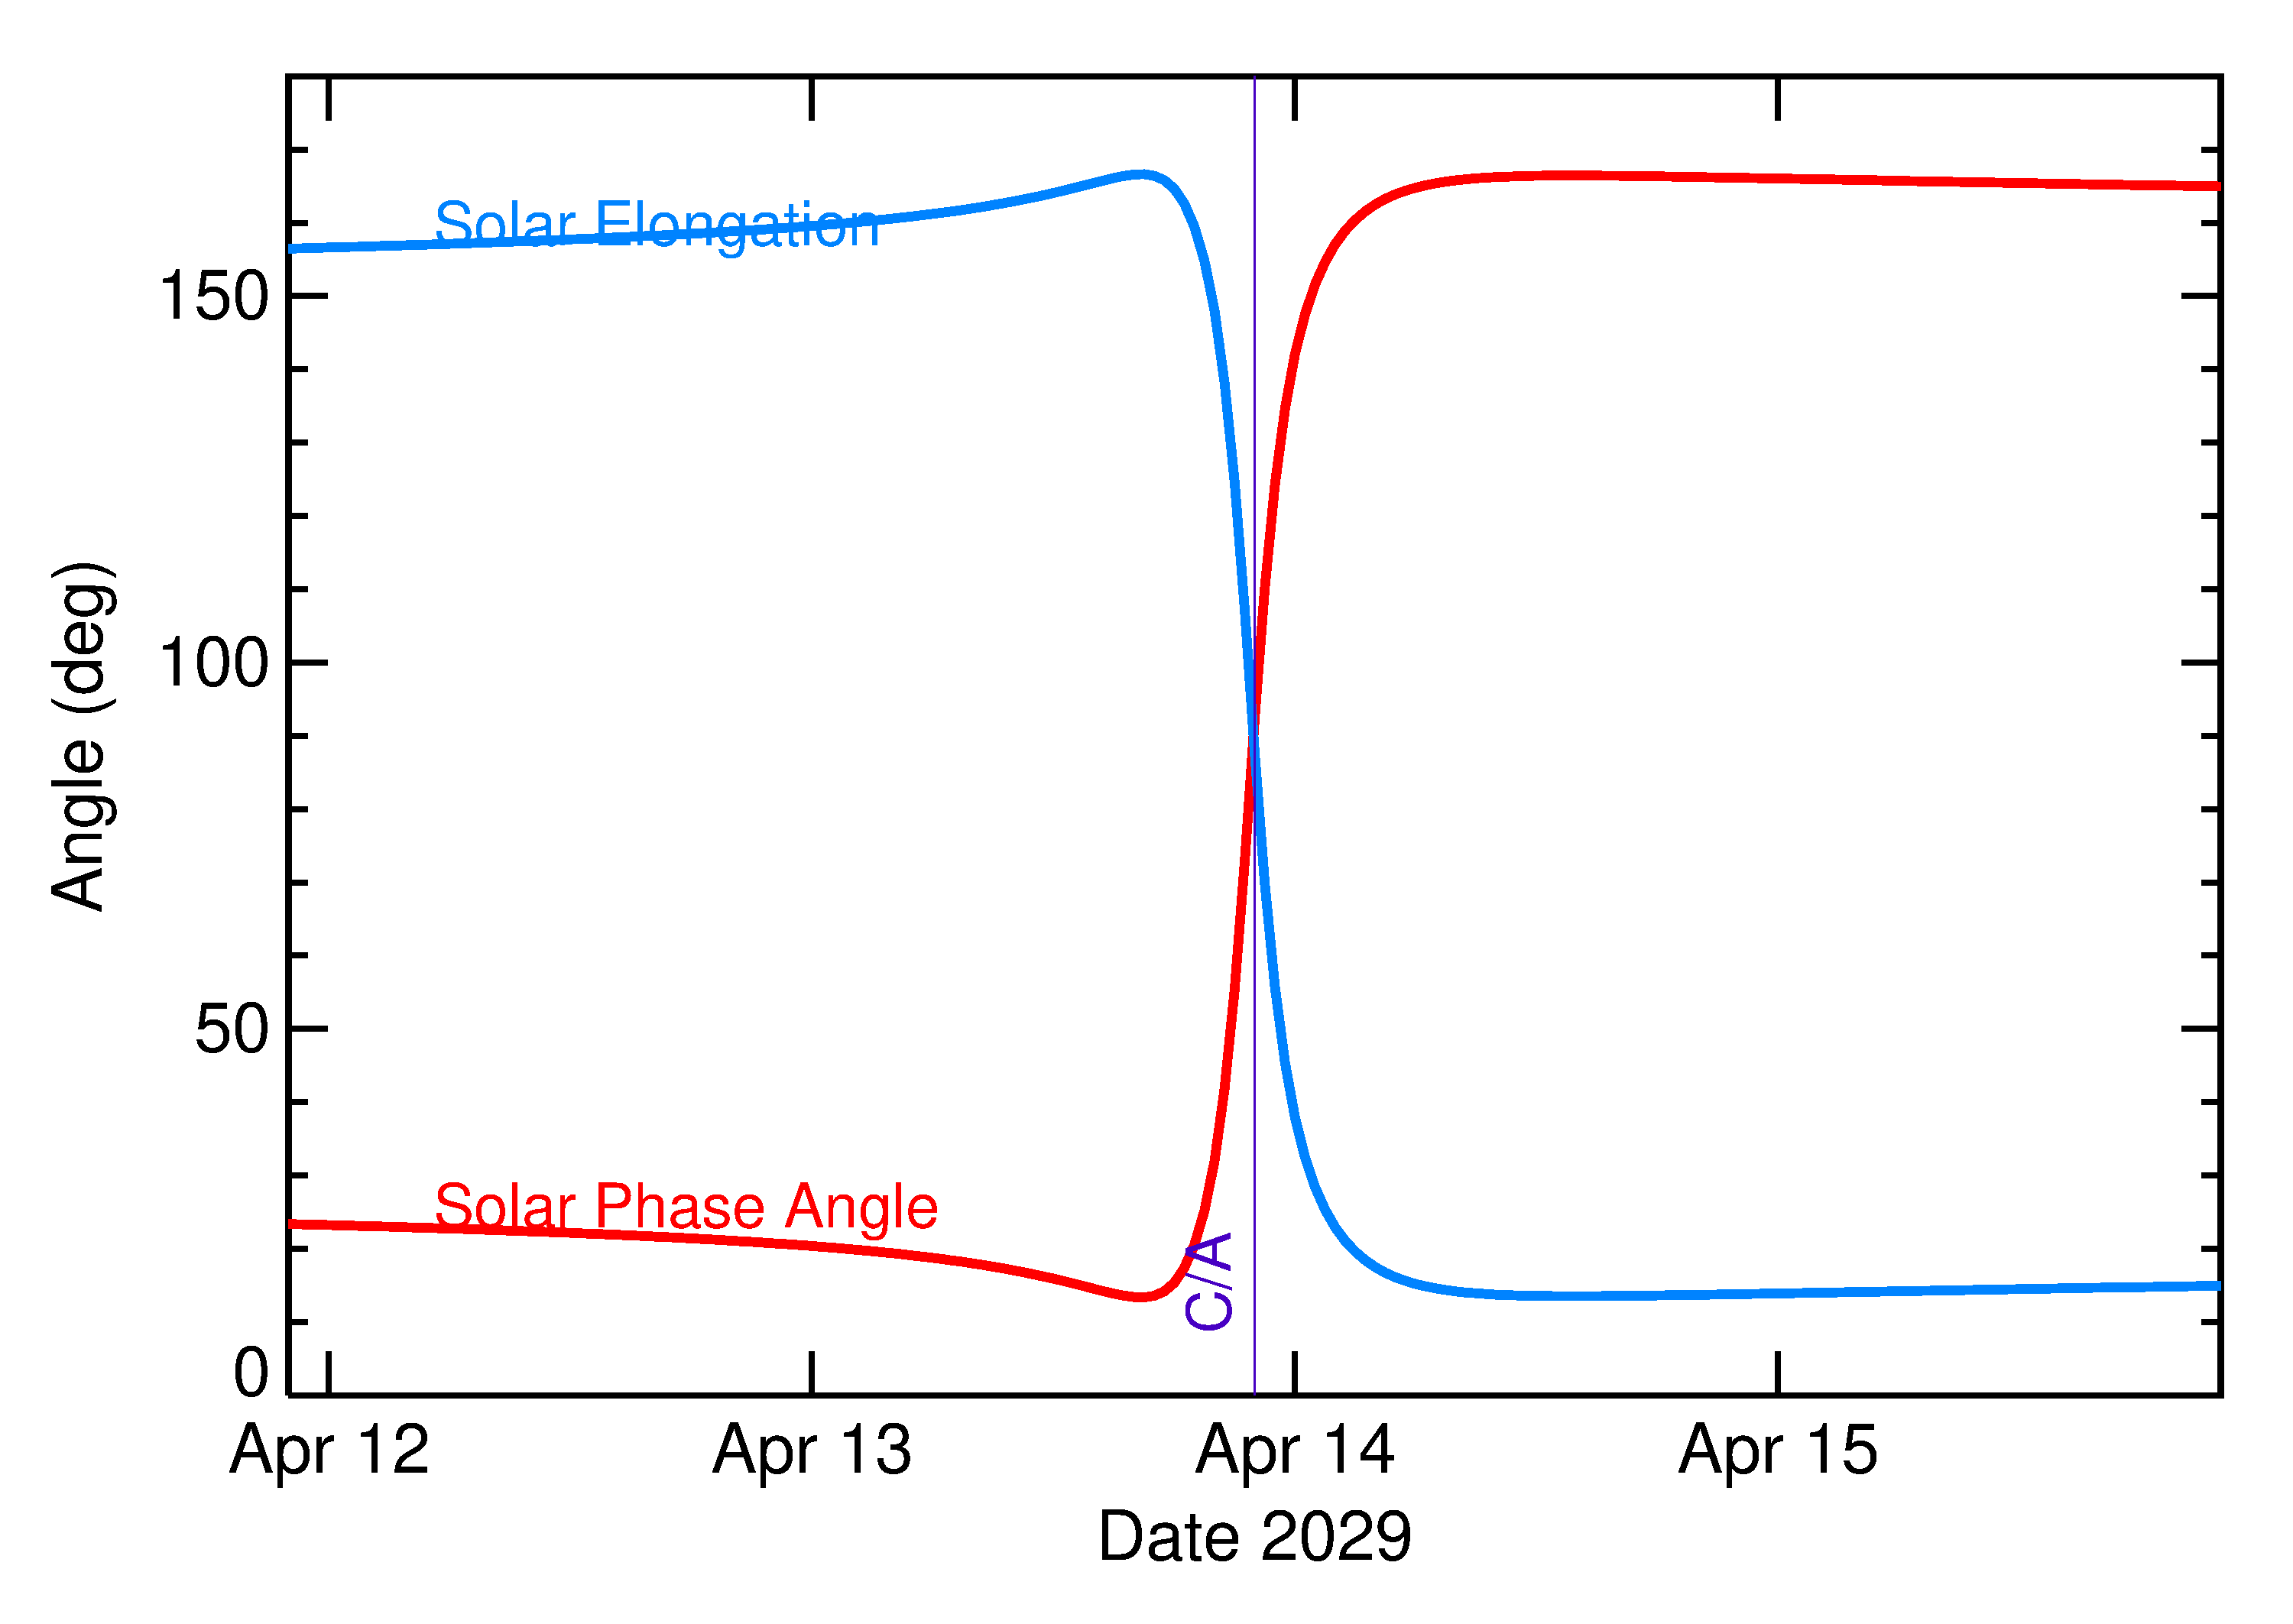
Solar Elongation and Solar Phase Angle
Expanded view of the angles around close approach: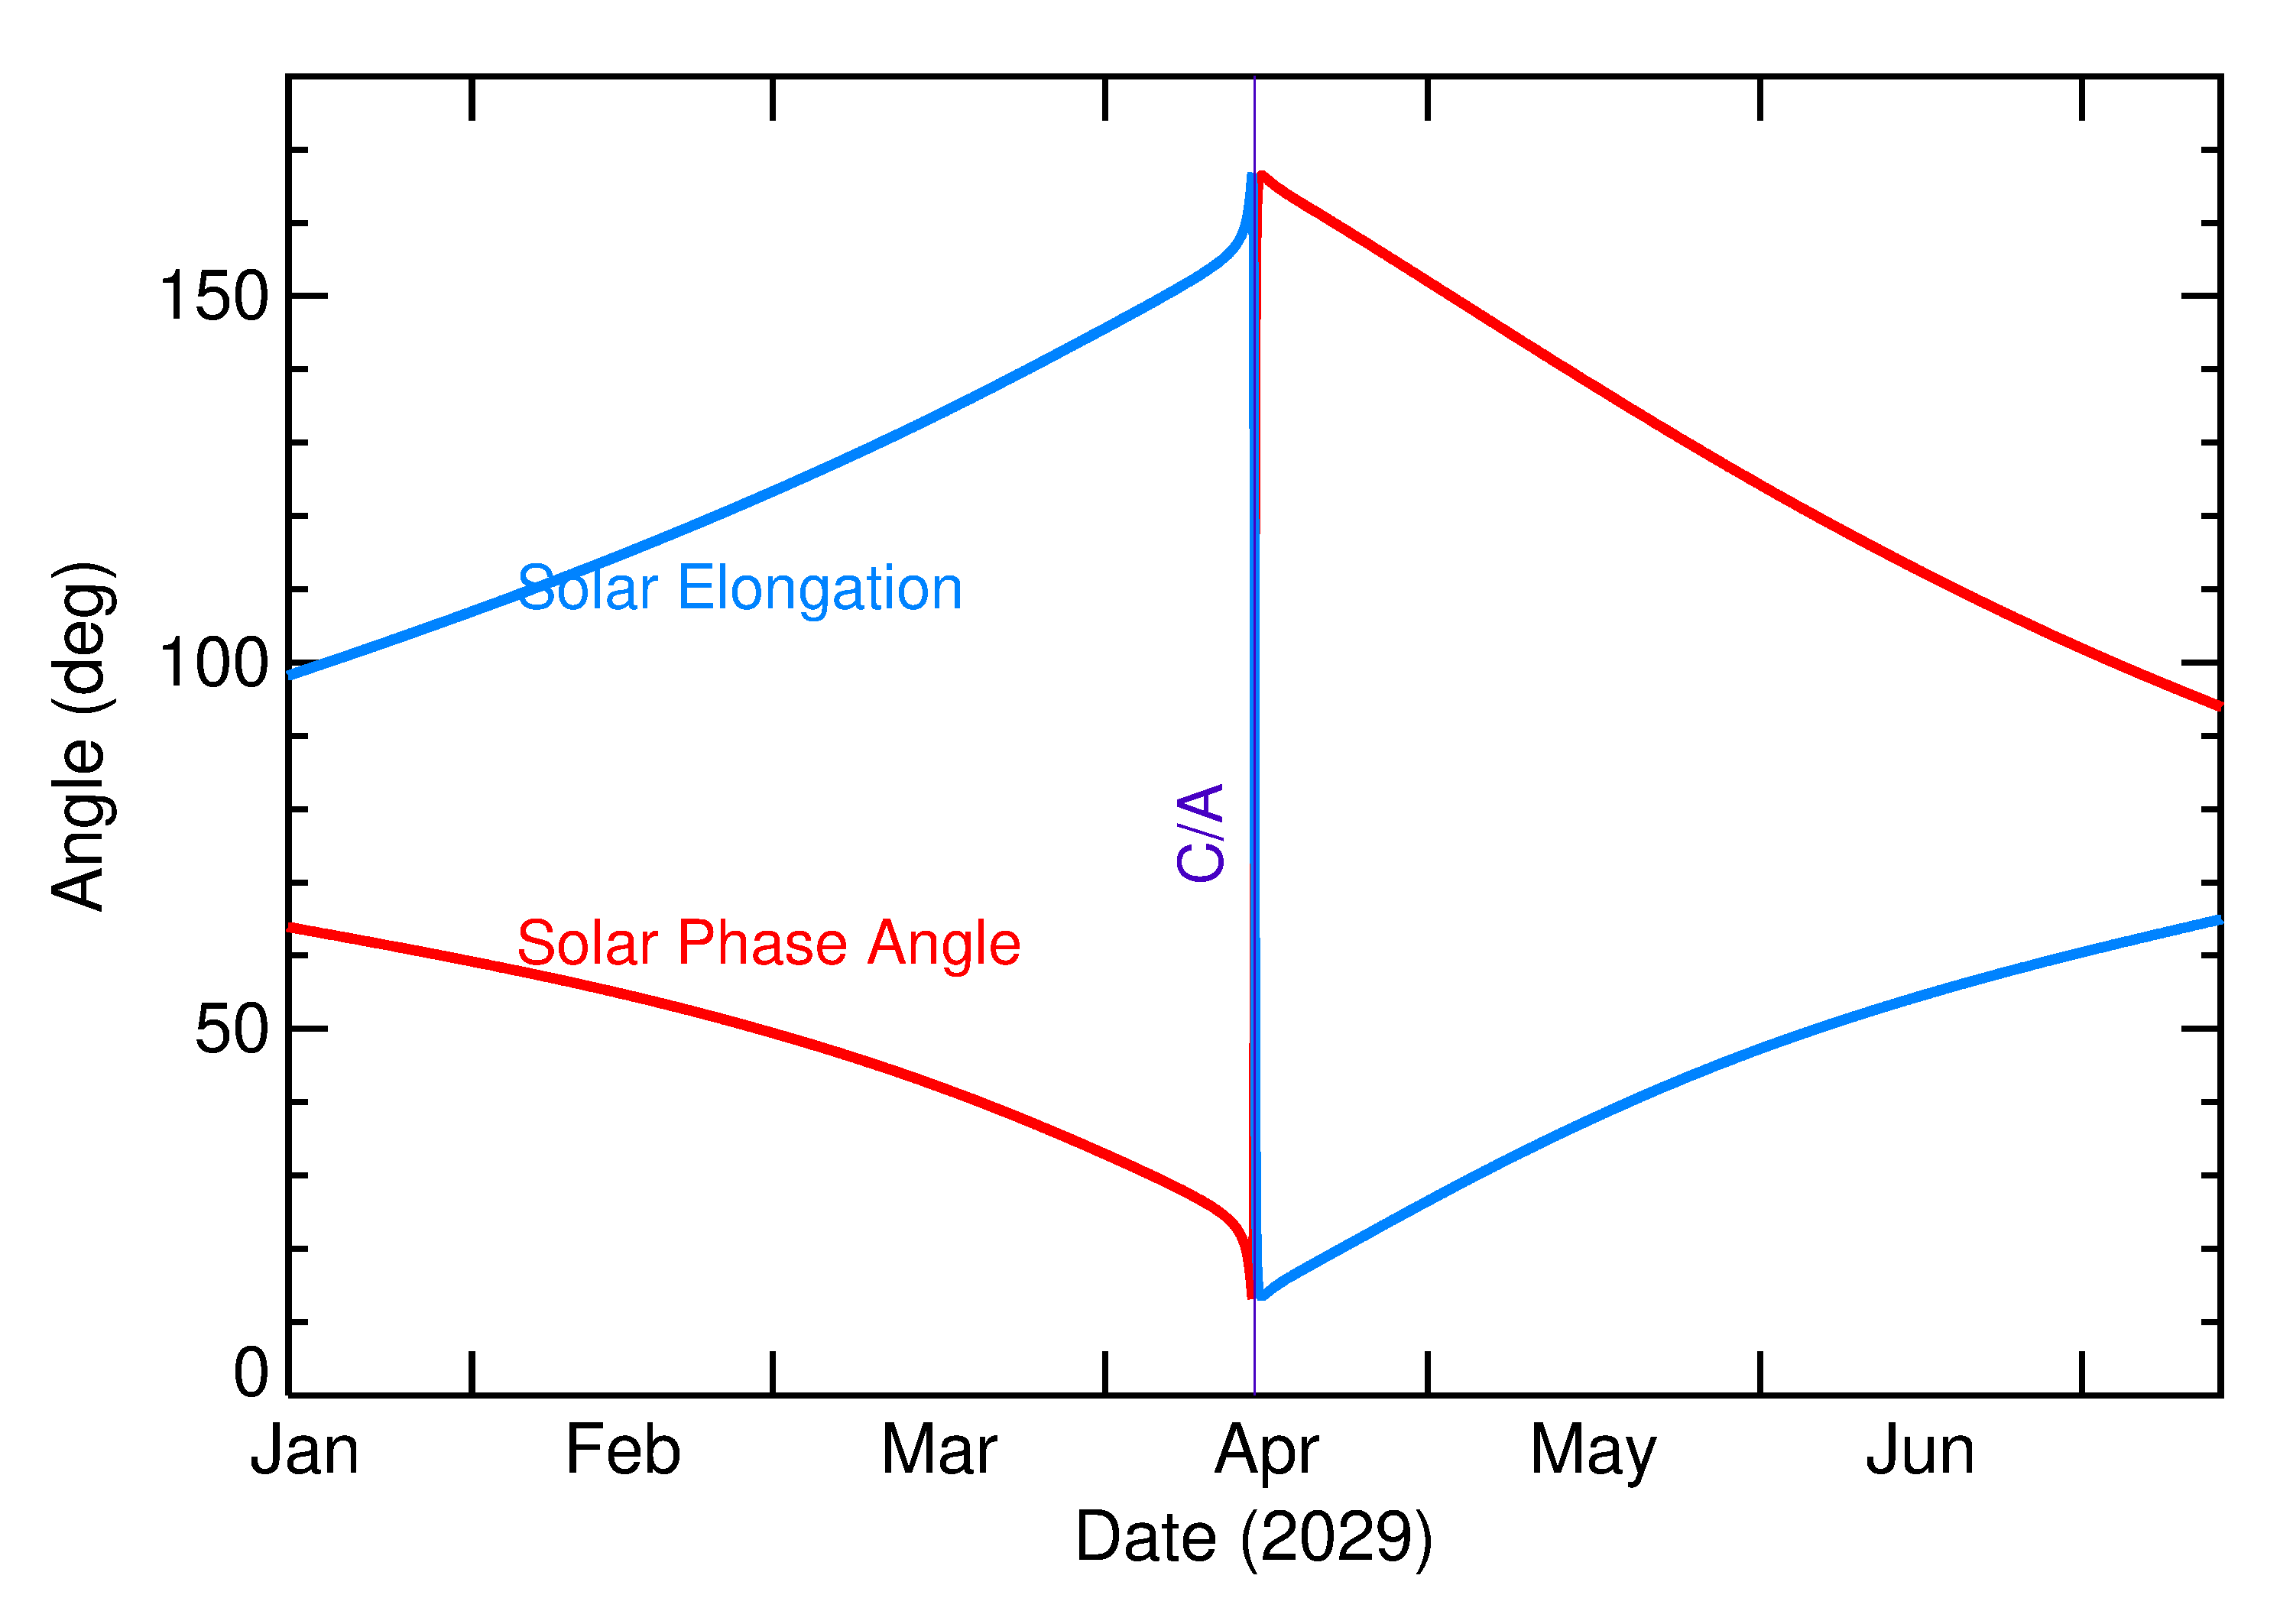
Rate of Motion
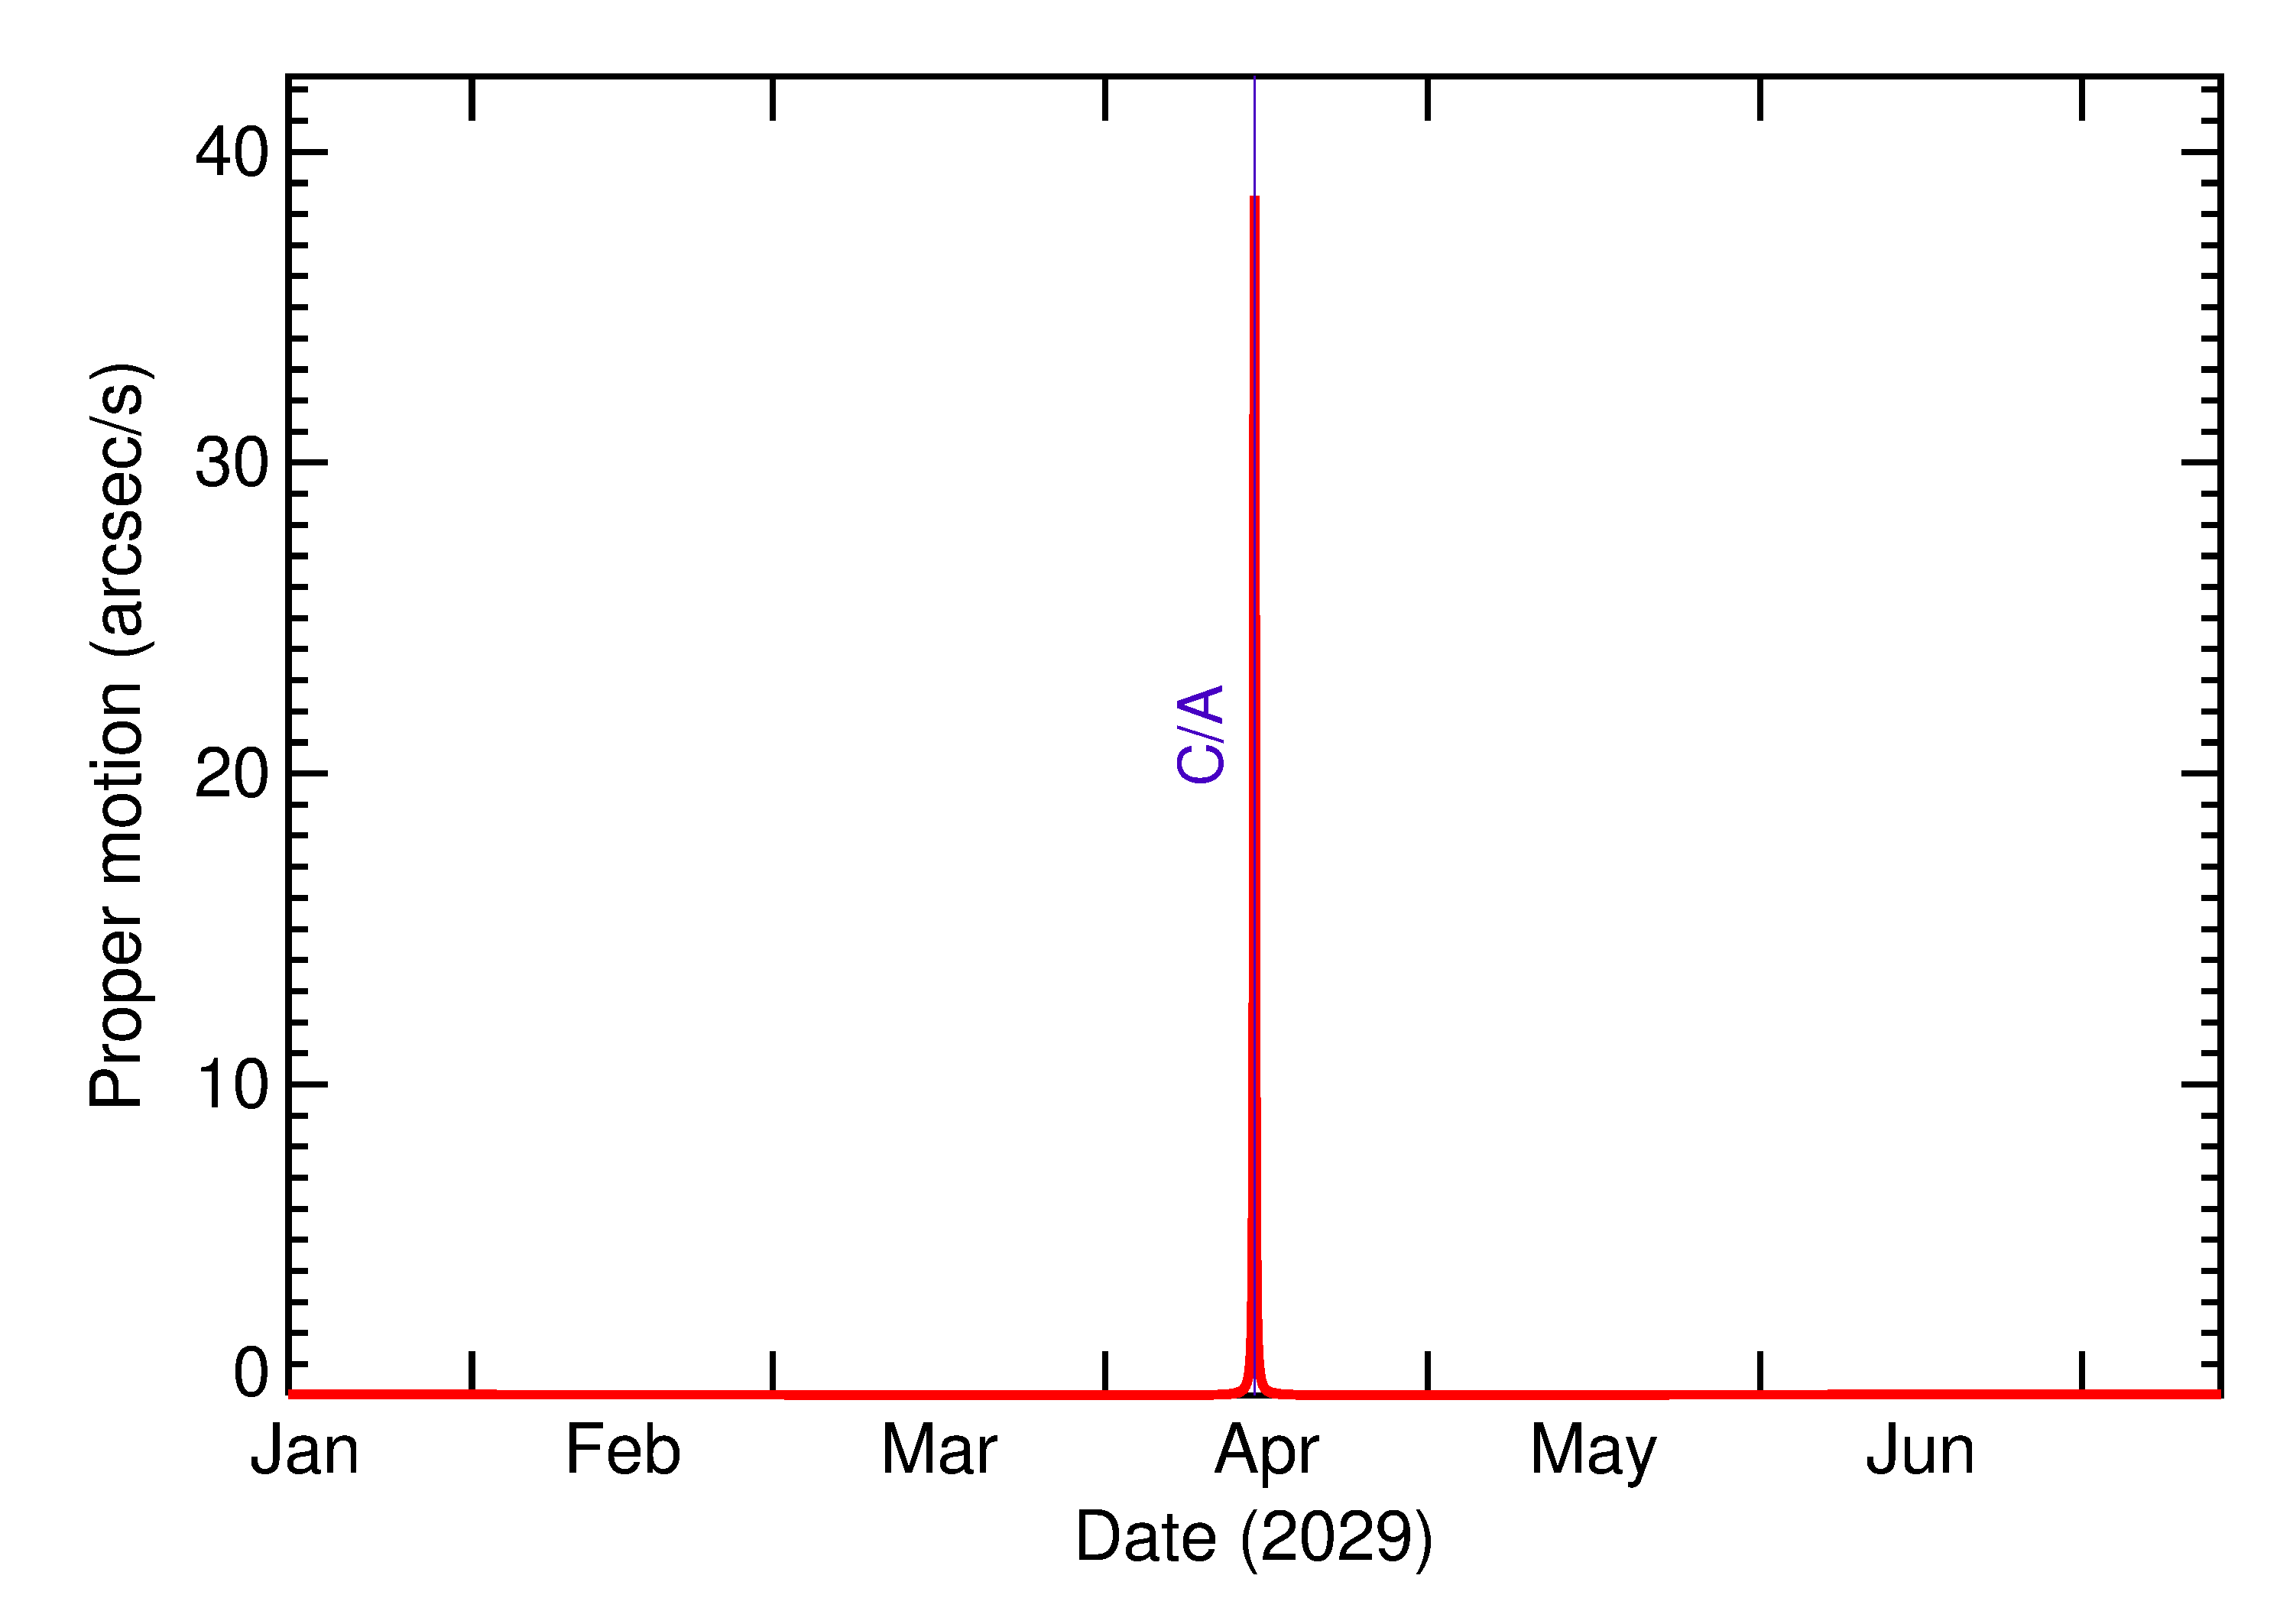
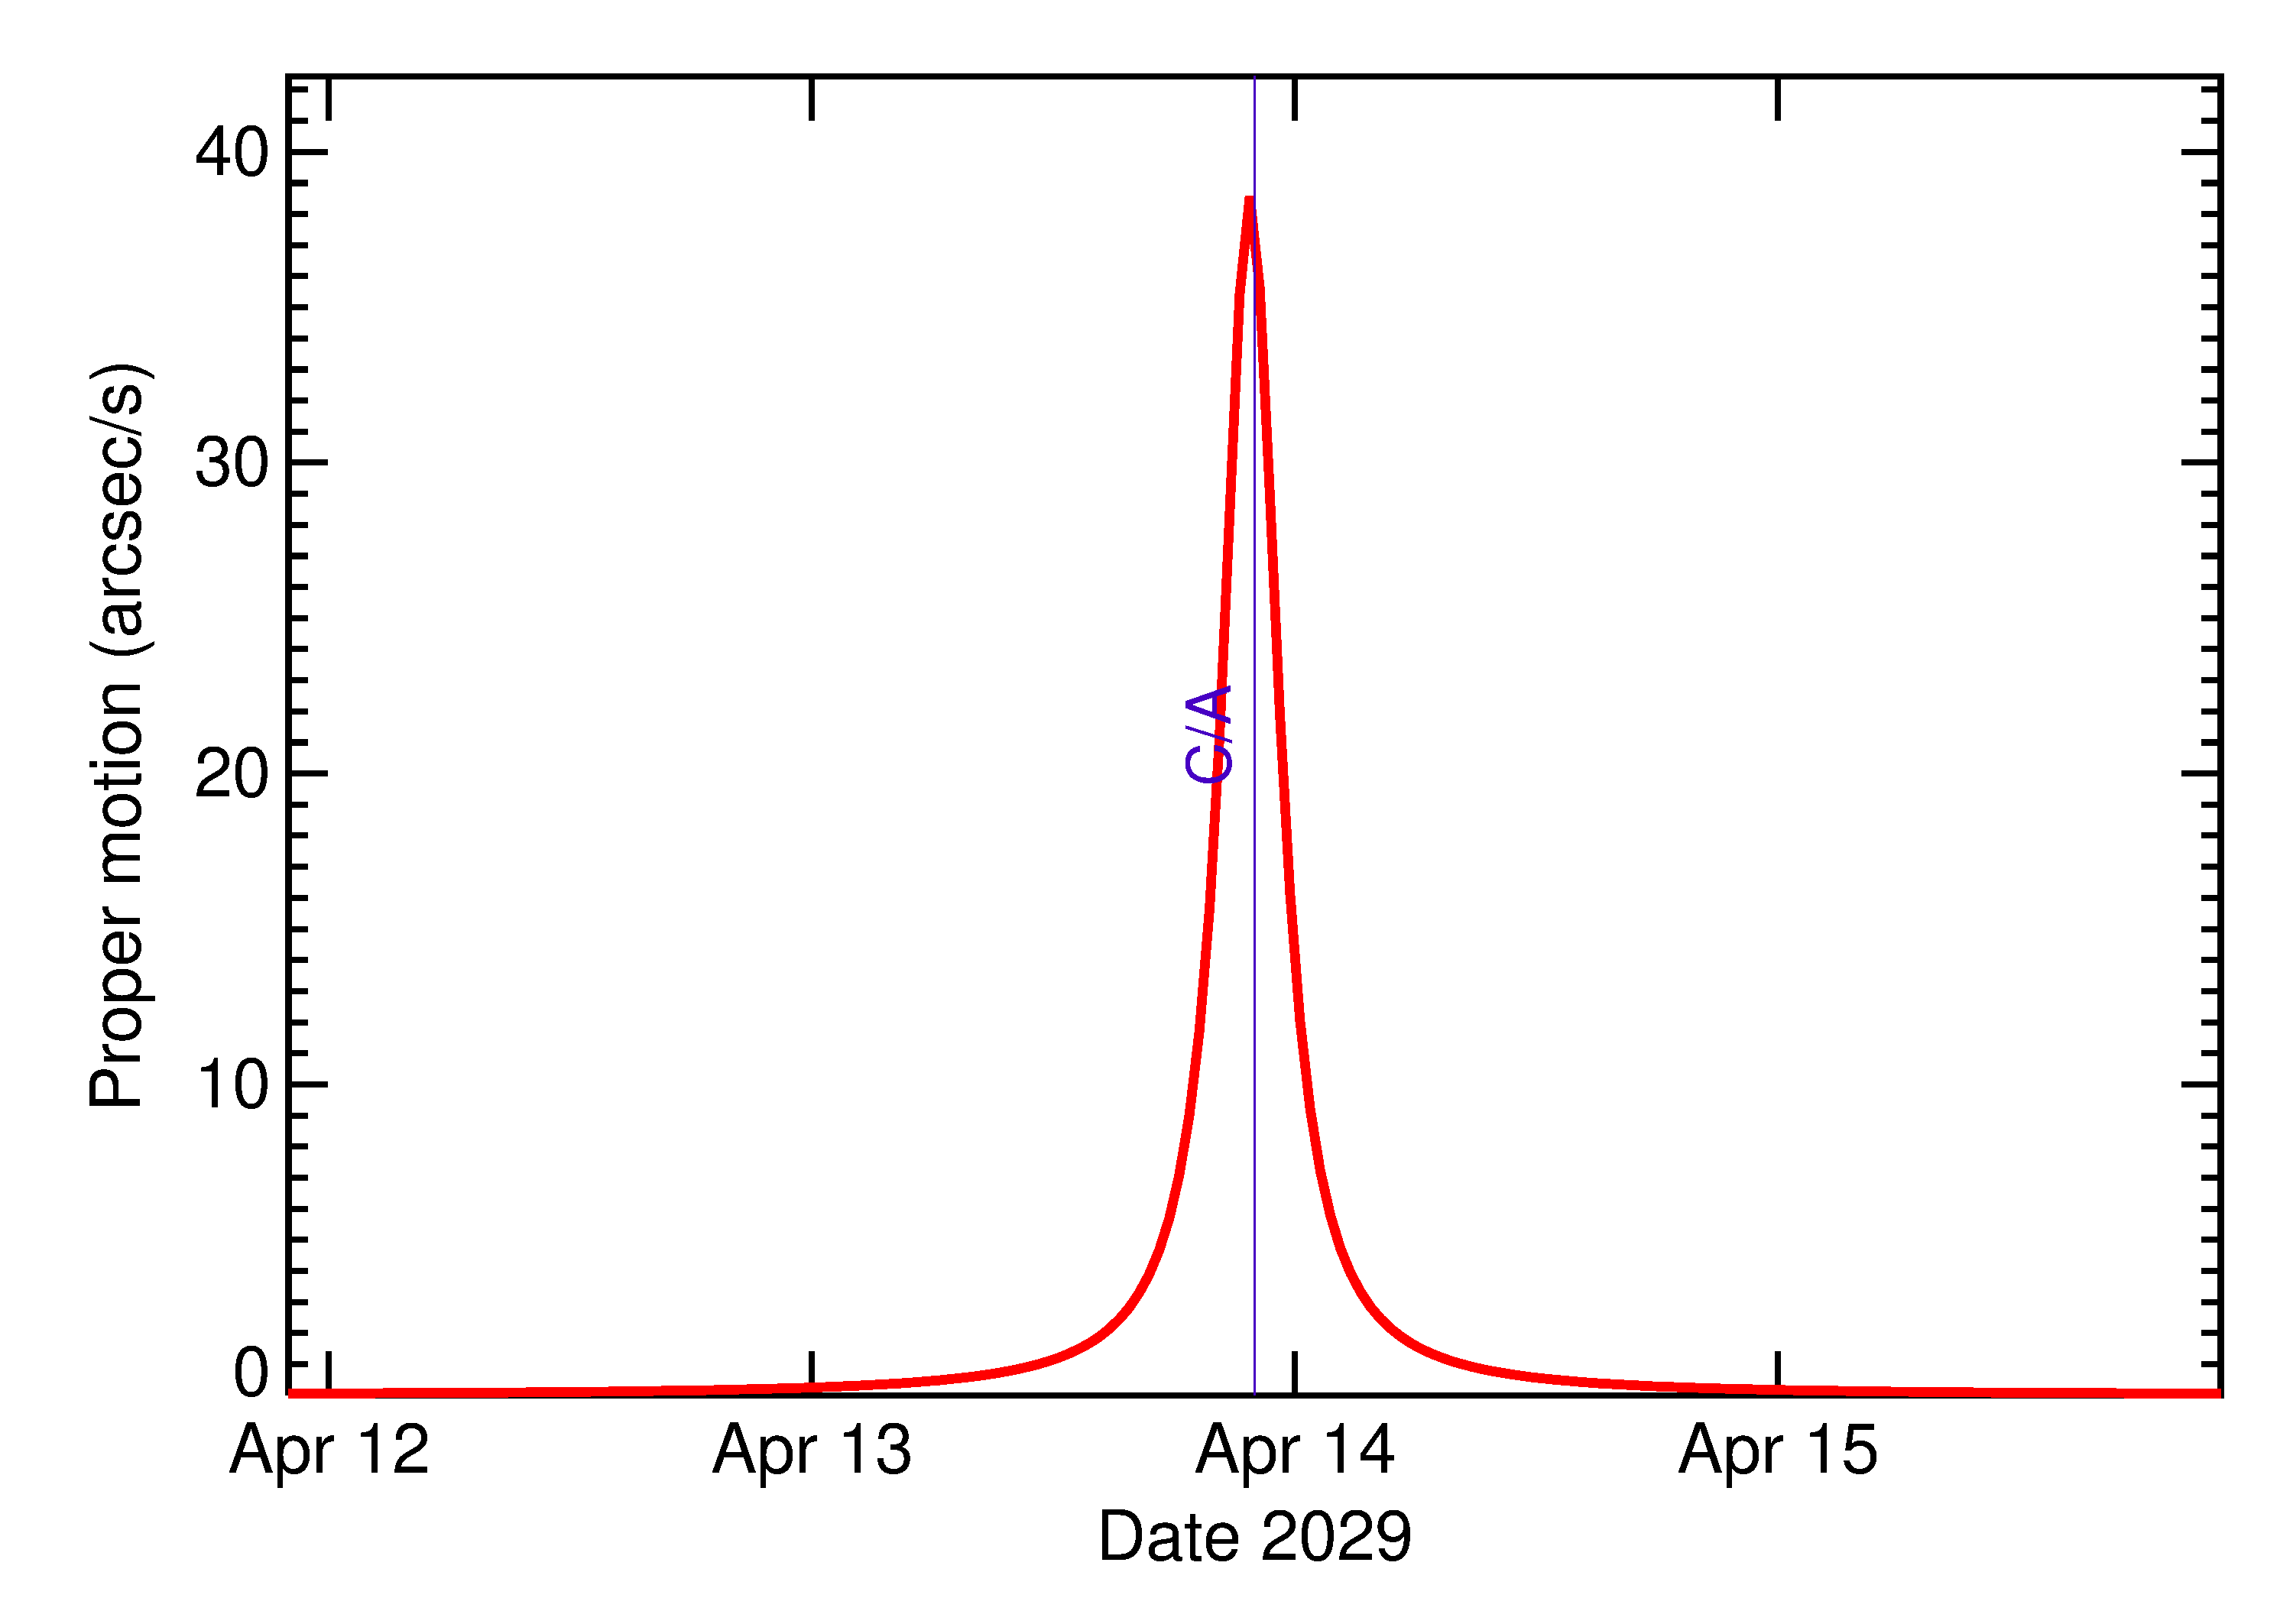
Apophis_rates.pdf
Apophis_rates2.pdf
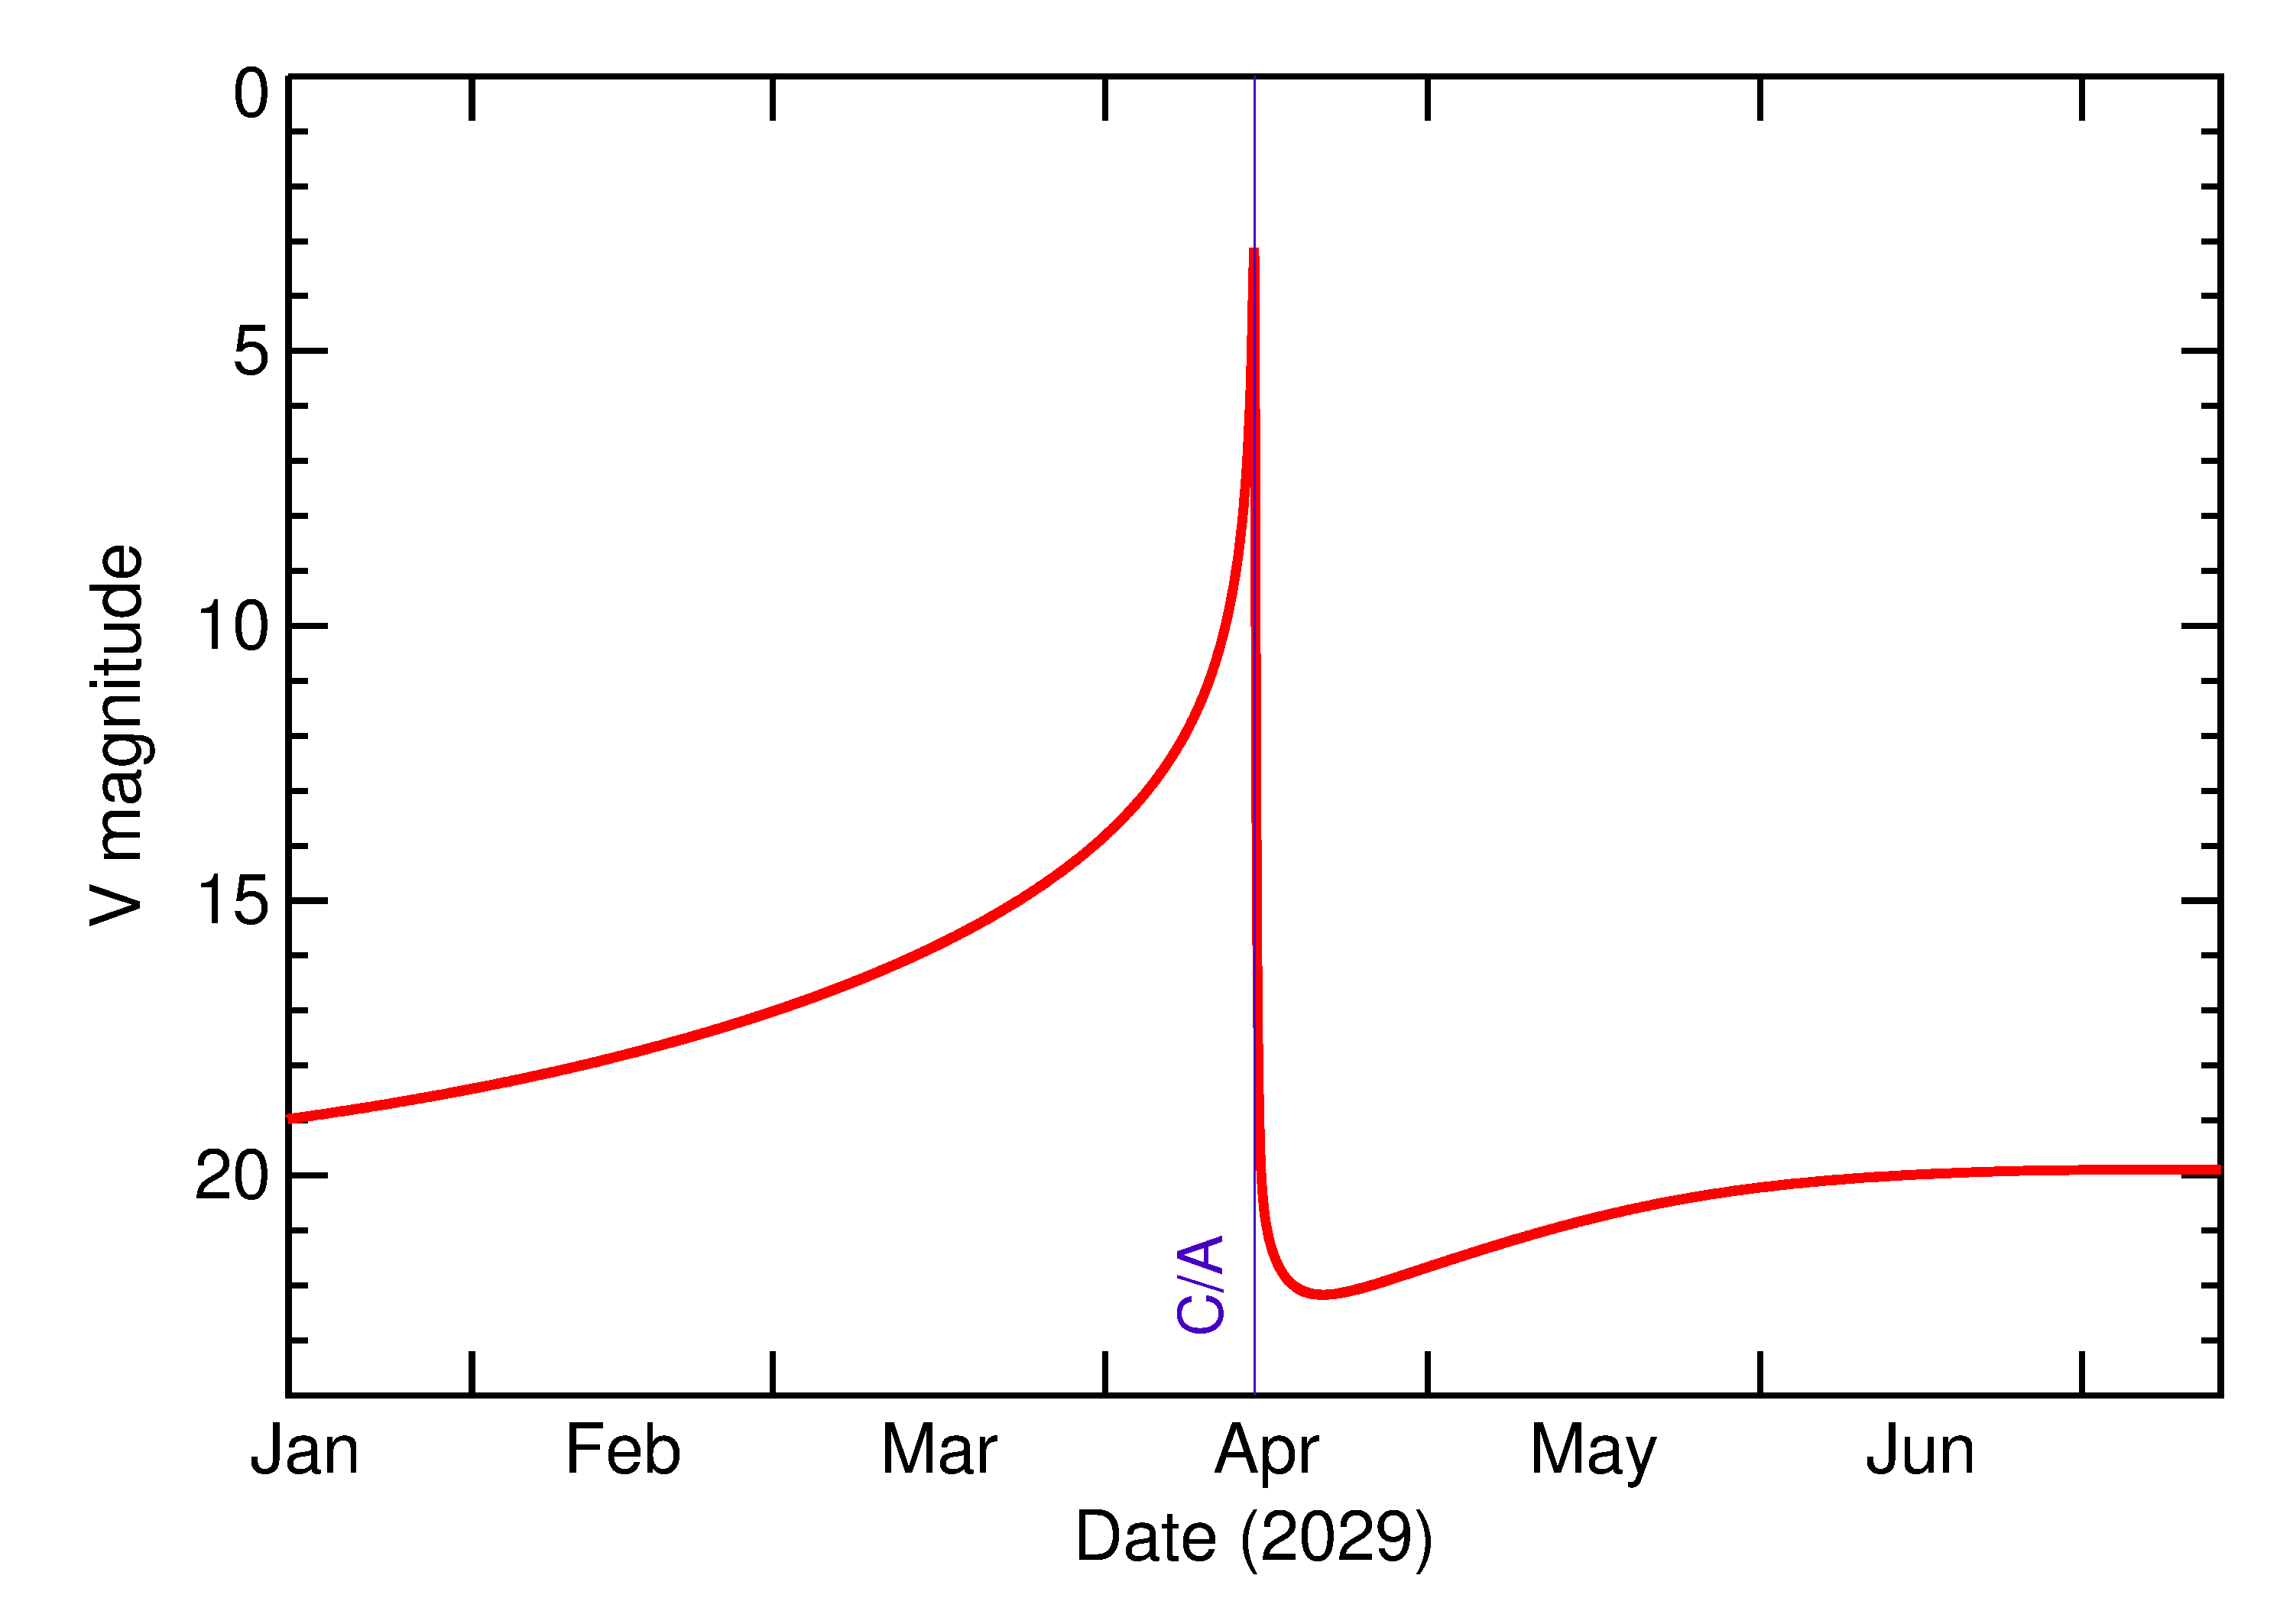
Predicted Brightness
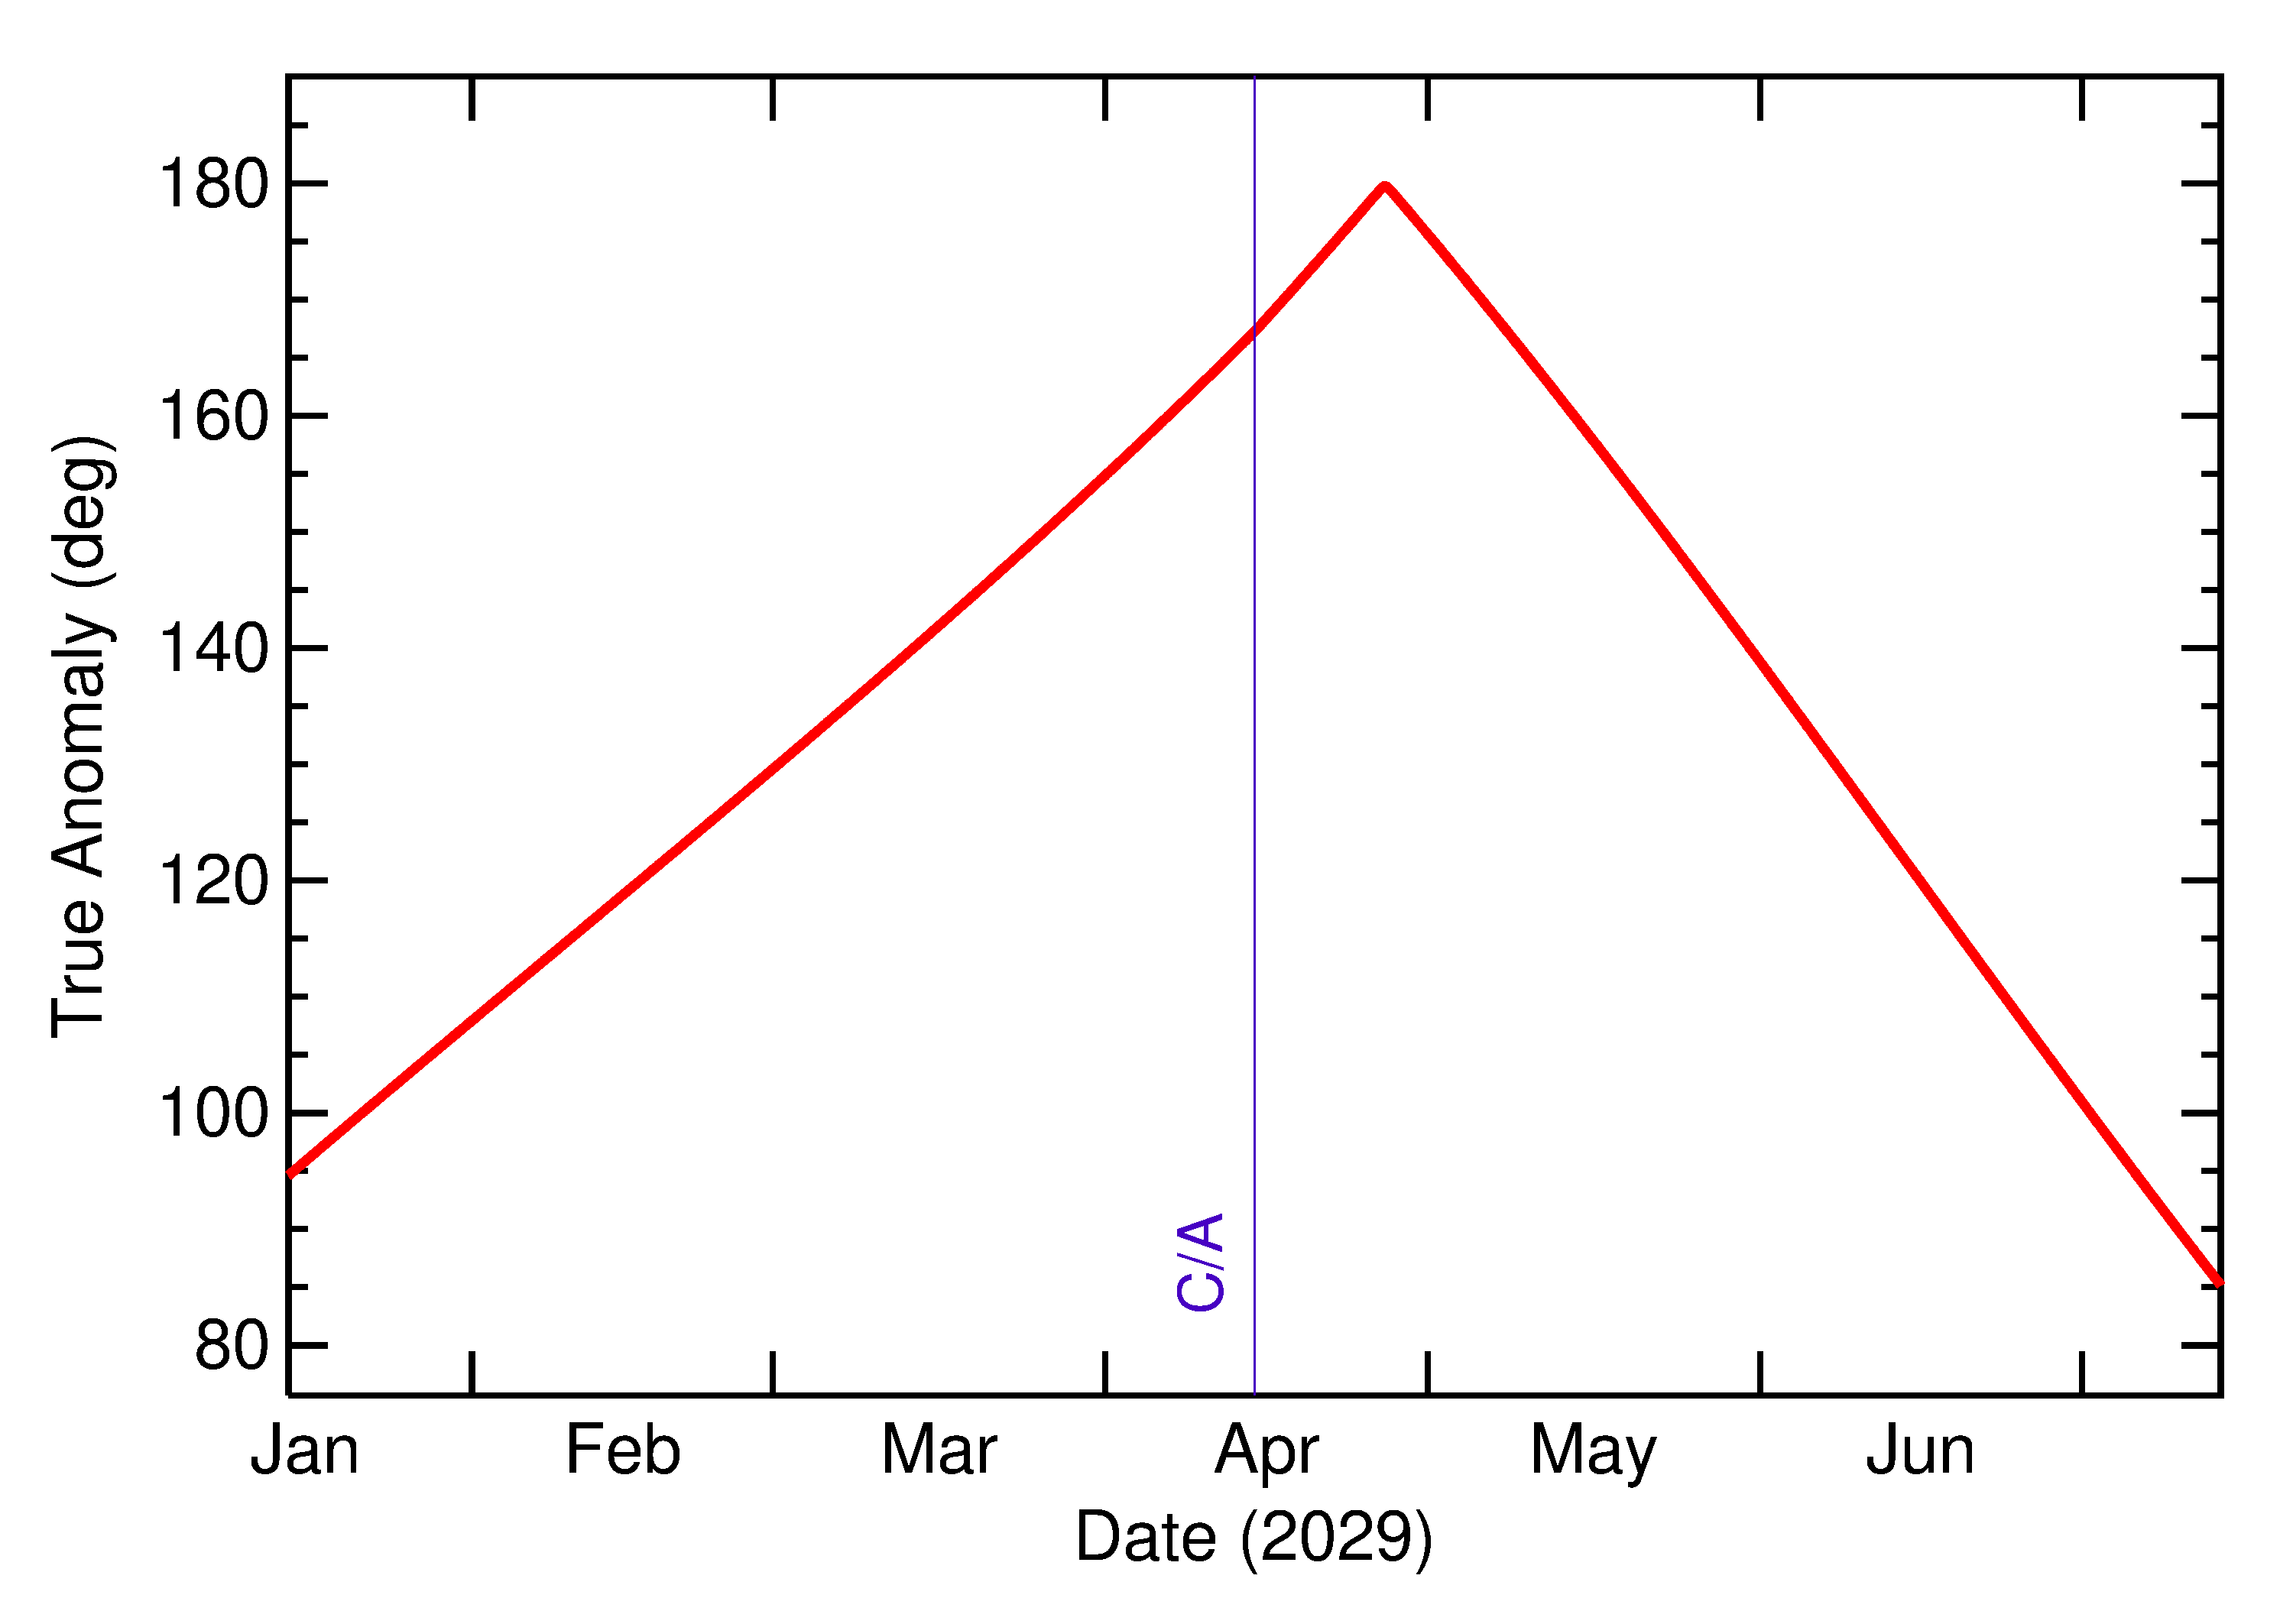
True Anomaly
Notice that the true anomaly may have a discontinuity at close approach, which is caused by the changes in the asteroid's orbit from the gravitational effects of the Earth.
Rise, set and visibility from different latitudes
The asteroid rises and sets at different times depending on the observer's latitude and longitude. The plots below provide information for approximating when the asteroid will be visible, and how long it will be observable from a given location on a given date.
Plots are given for latitude intervals of 5°, which is usually close enough for general planning purposes. Rise and set times are given in UTC for 0° longitude. For other latitudes, these times will be approximate to the local time, which should again be sufficient for basic planning purposes. Note, however, that there will be an offset (typically < 1/2 hr) for different longitudes, so if more accuracy is needed, then you should obtain a more detailed ephemeris.
How to read these plots
We provide a more detailed description of the Rise/Set and visibility plots, and an example of how to read the information here (PDF).
Asteroid visibility (TimeUp) and Rise/Set plots
If there is another major observatory for which you'd like to see details, please let know.
| 2029 Encounter | ||
|---|---|---|
| Goldstone (+35.4) | Timeup | Rise/Set |
| DCT (+34.7) | Timeup | Rise/Set |
| Spacewatch (+32) | Timeup | Rise/Set |
| La Palma (+28.8) | Timeup | Rise/Set |
| IRTF (+19.8) | Timeup | Rise/Set |
| Arecibo (+18.4) | Timeup | Rise/Set |
| La Silla (-29) | Timeup | Rise/Set |
| CTIO (-30.2) | Timeup | Rise/Set |
| Sutherland (-32.4) | Timeup | Rise/Set |