2022 WO6 Geometry
Heliocentric and Geocentric Distances
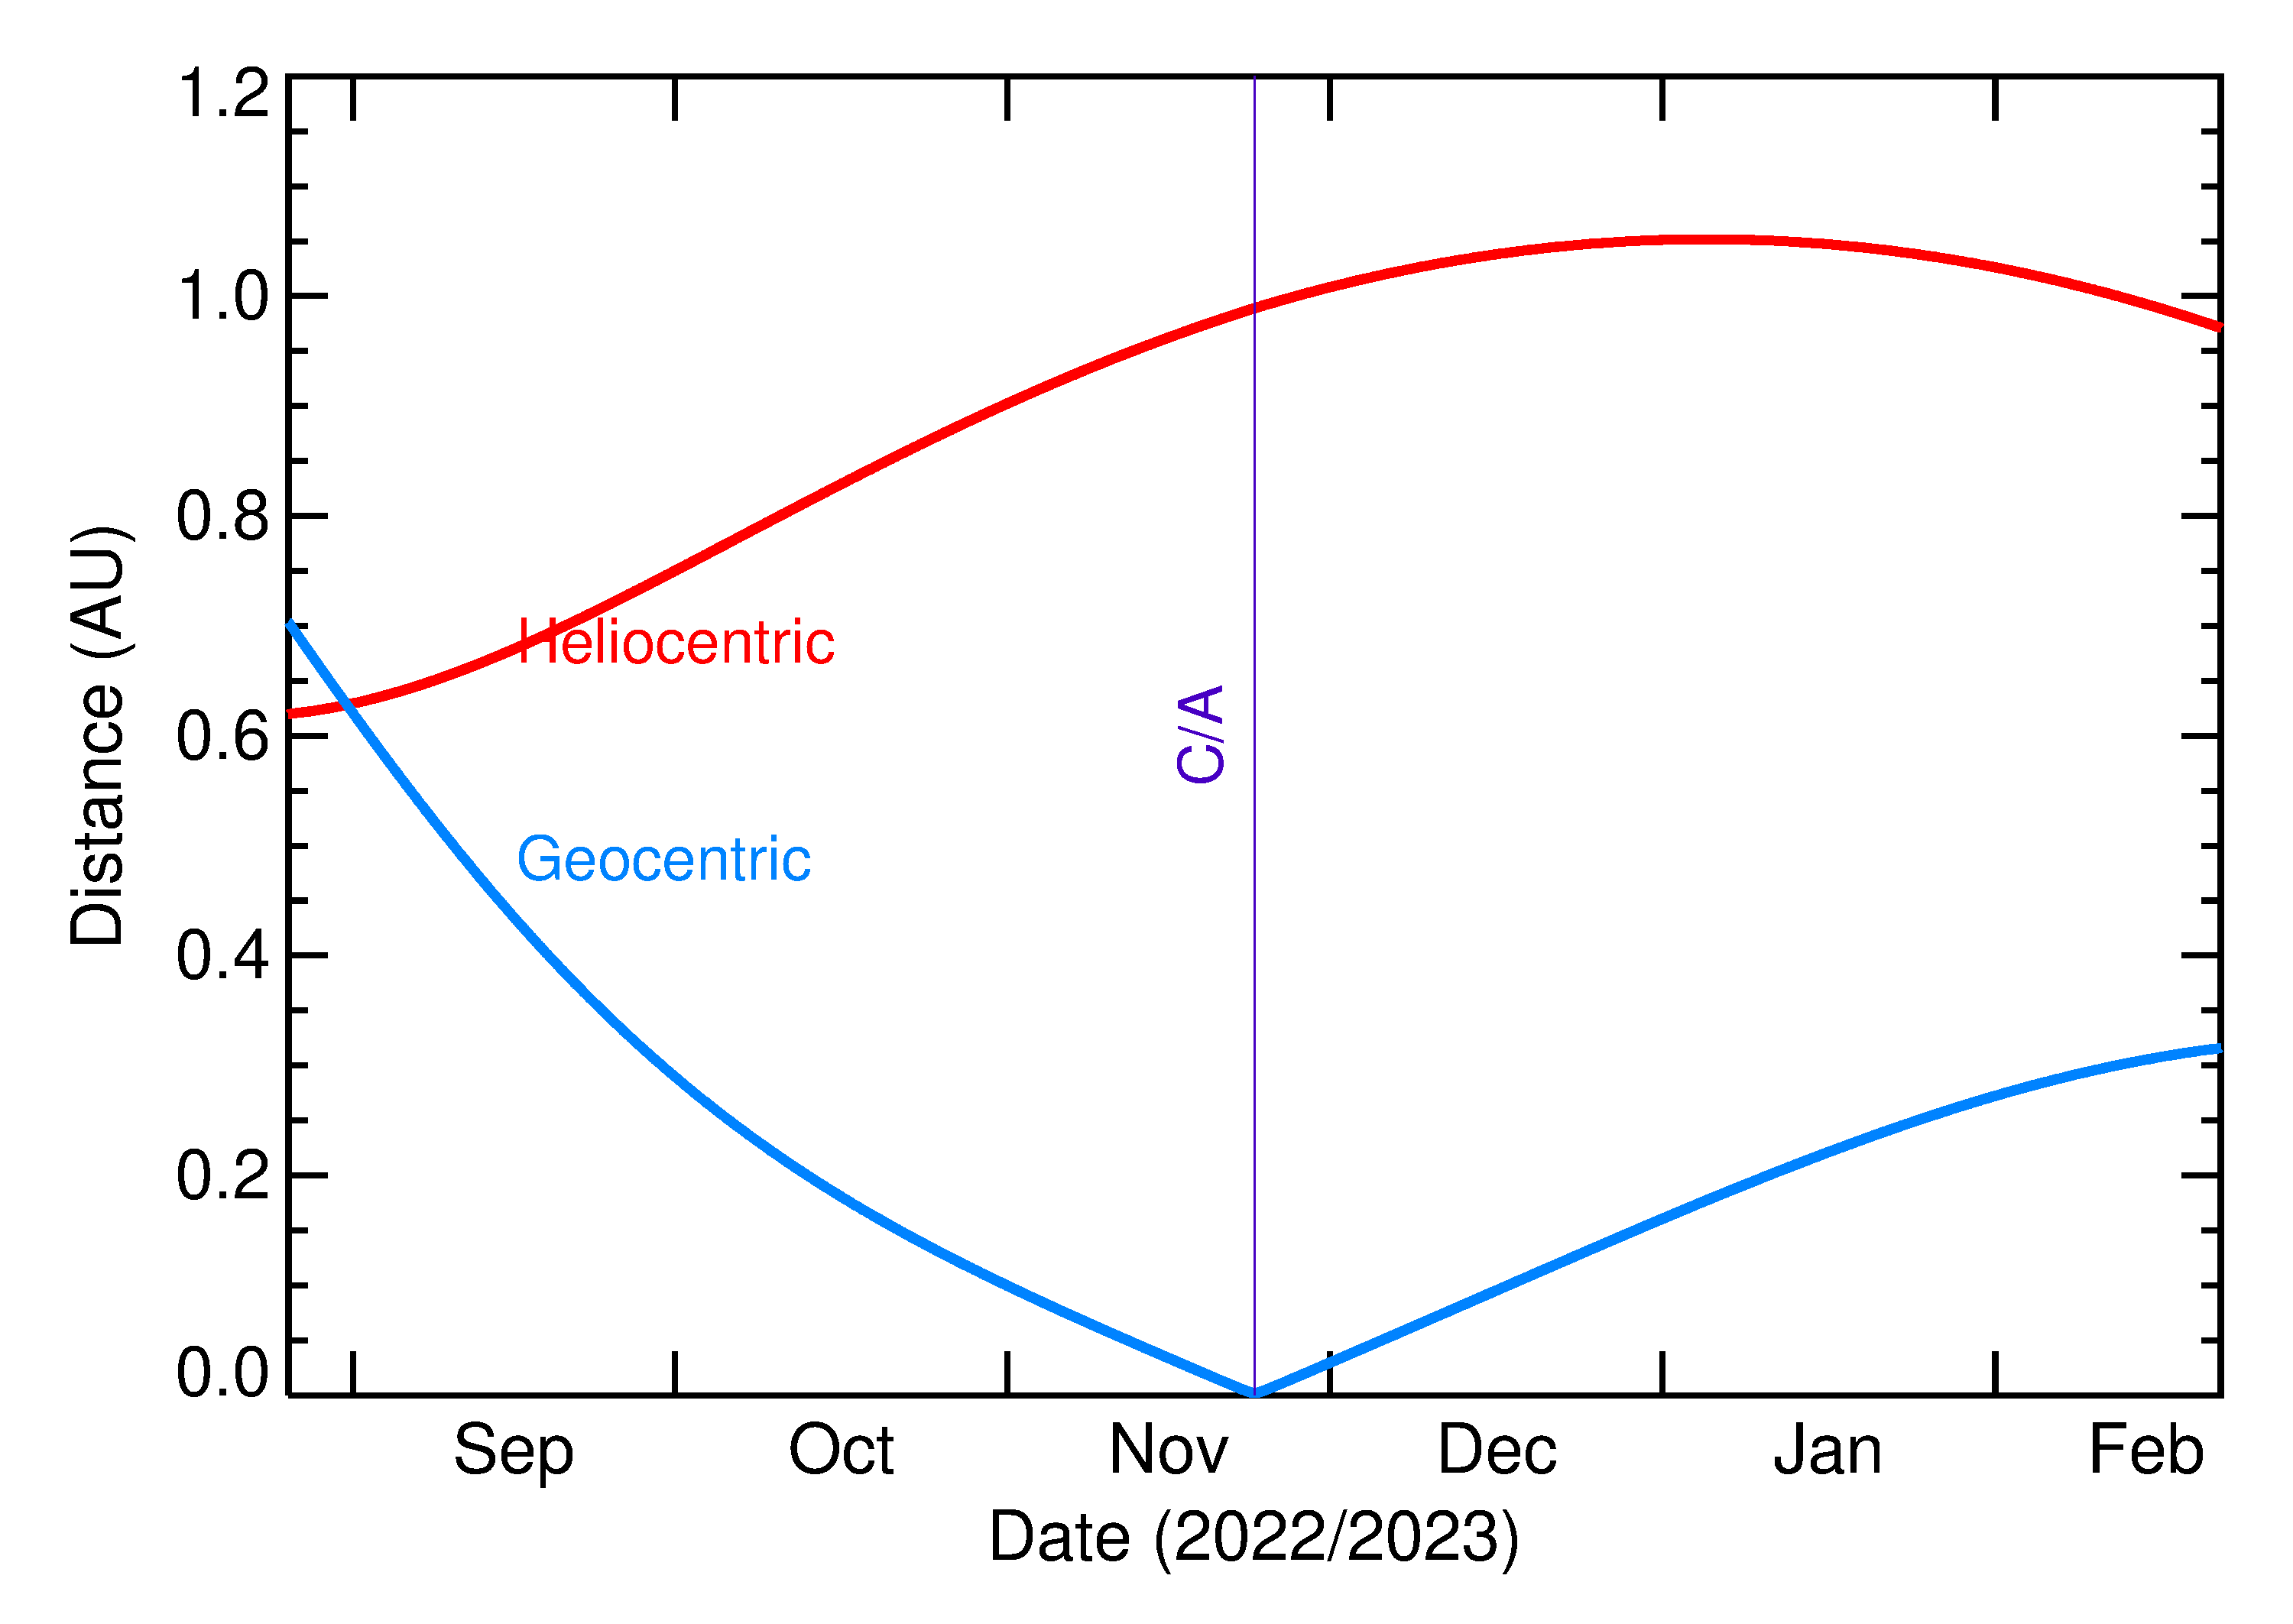
Heliocentric and Geocentric Distances of 2022 WO6 in the months around closest approach
Right Ascension and Declination
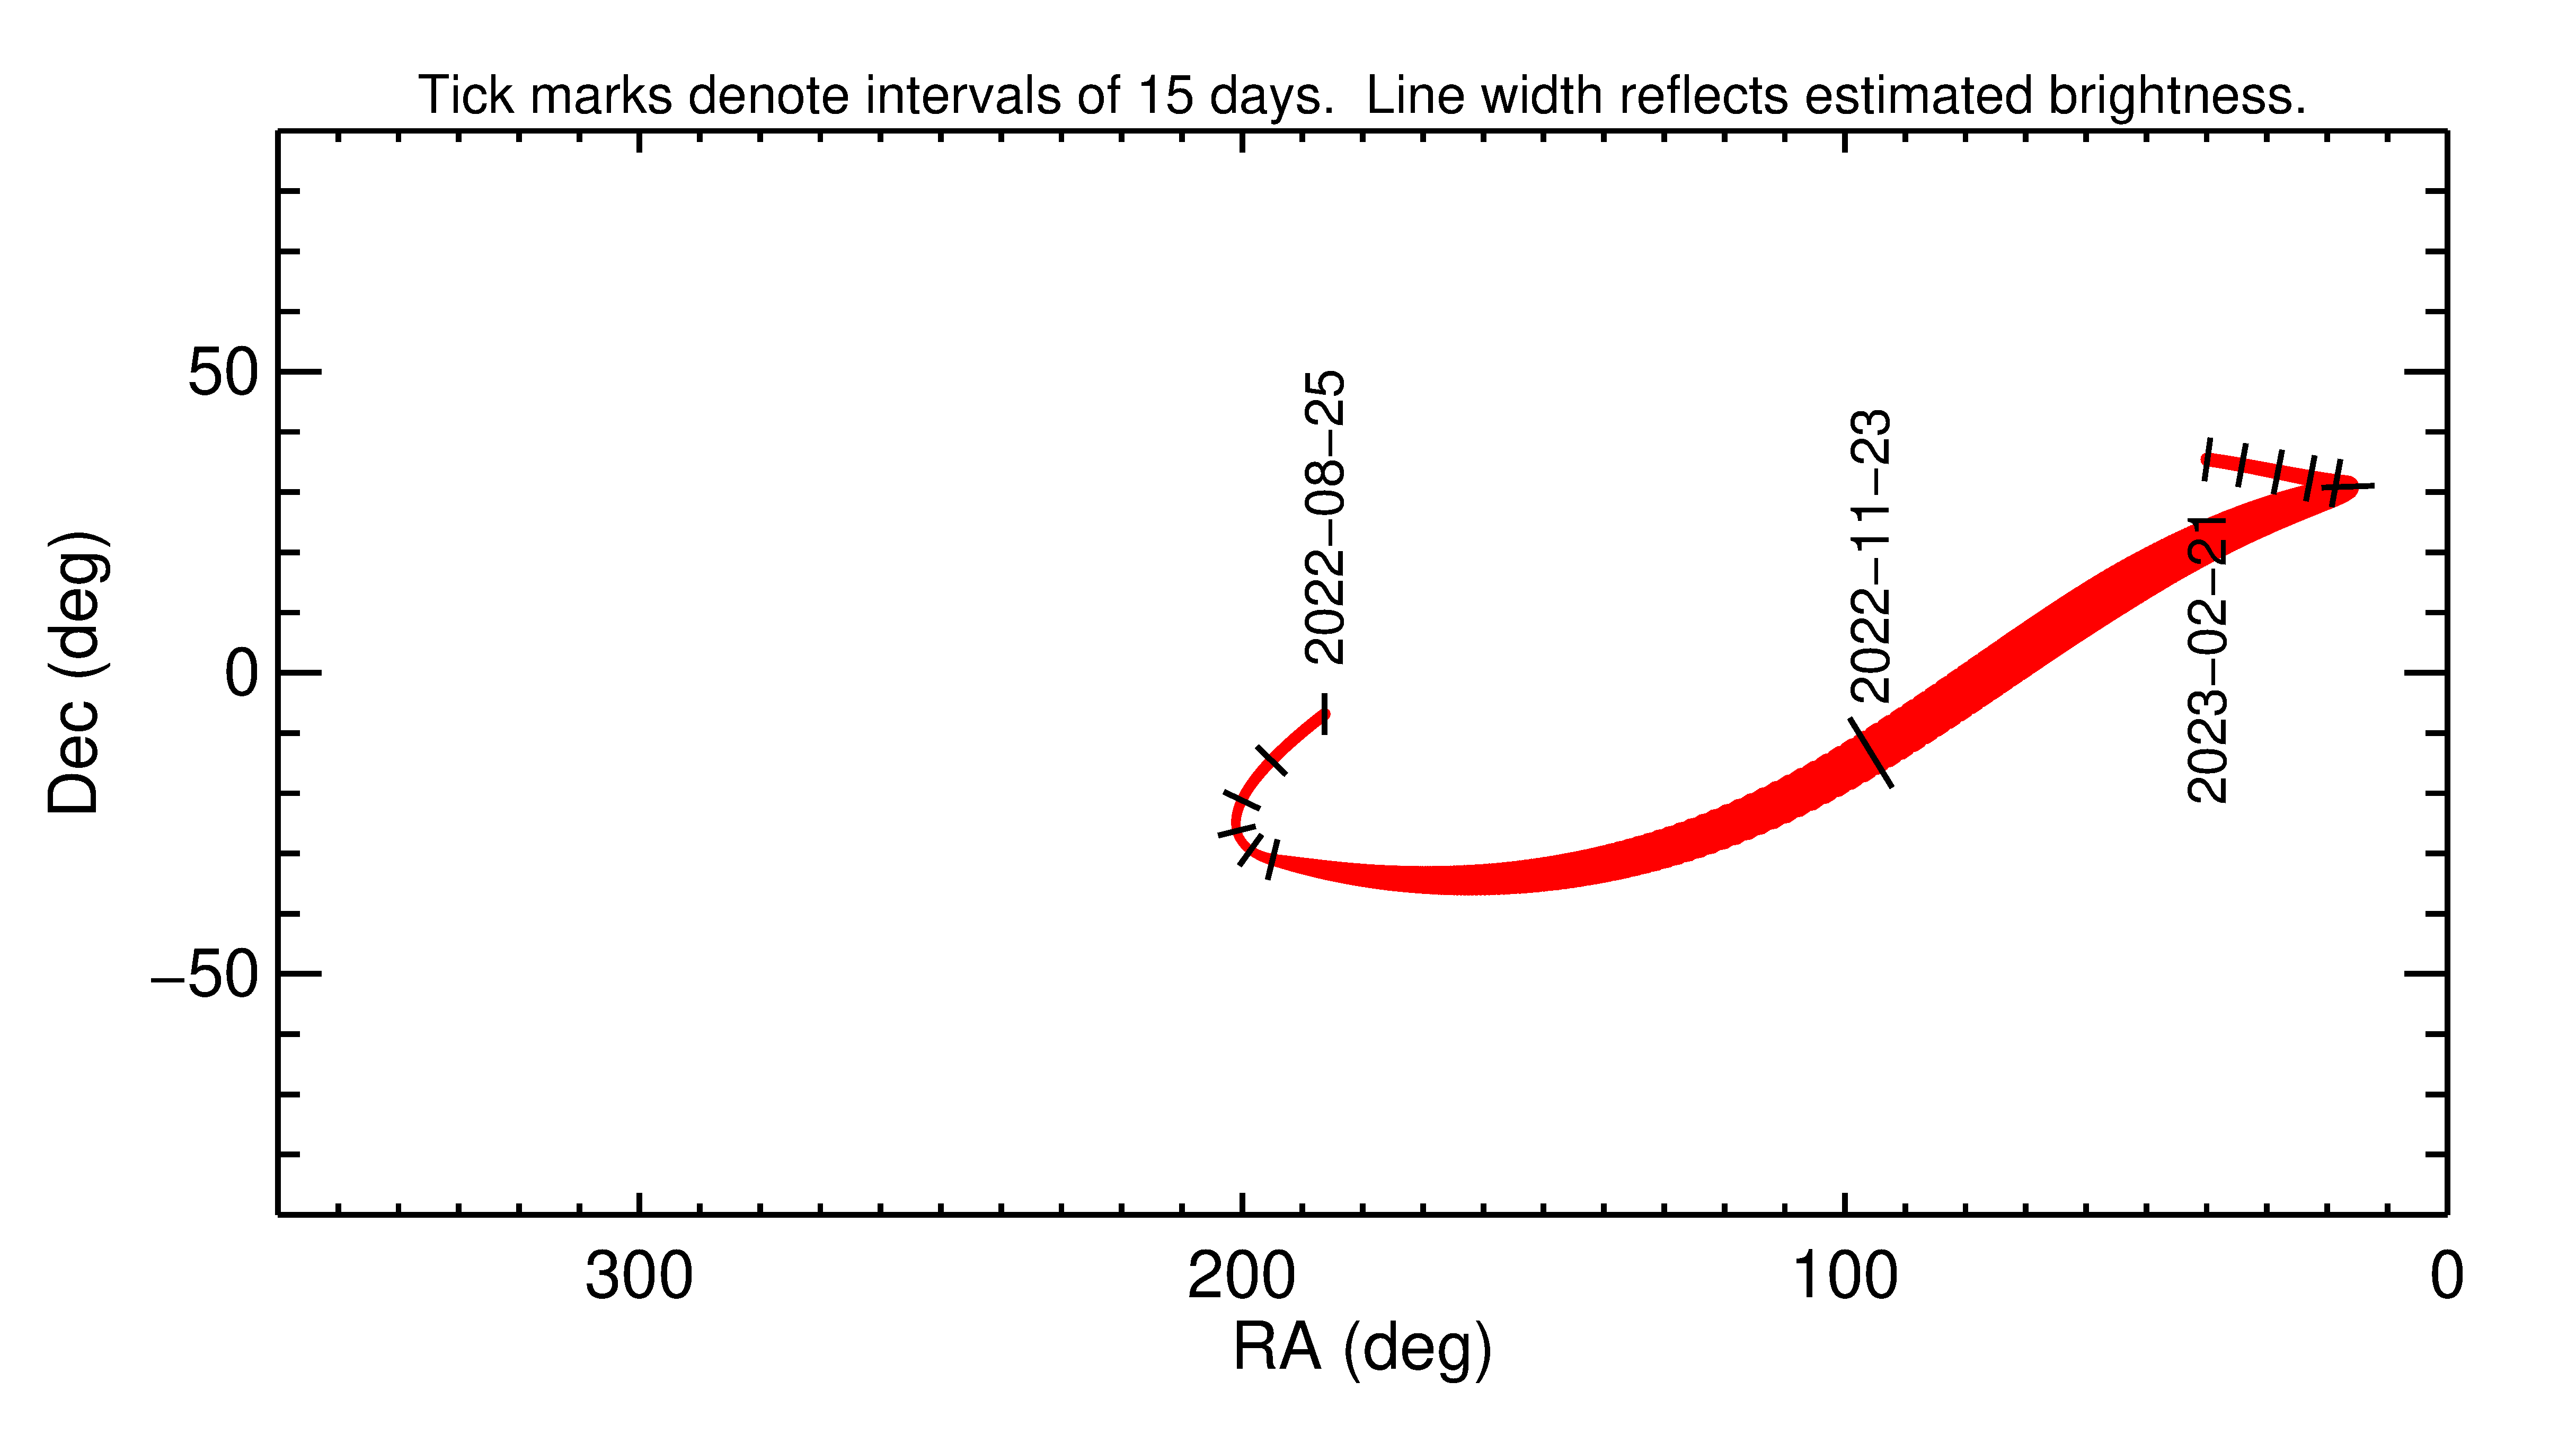
Celestial coordinates of 2022 WO6 in the 6 months around closest approach to Earth. Tick marks denote intervals of 15 days, and the width of the line estimates the relative brightness during the time interval.
Predicted Brightness
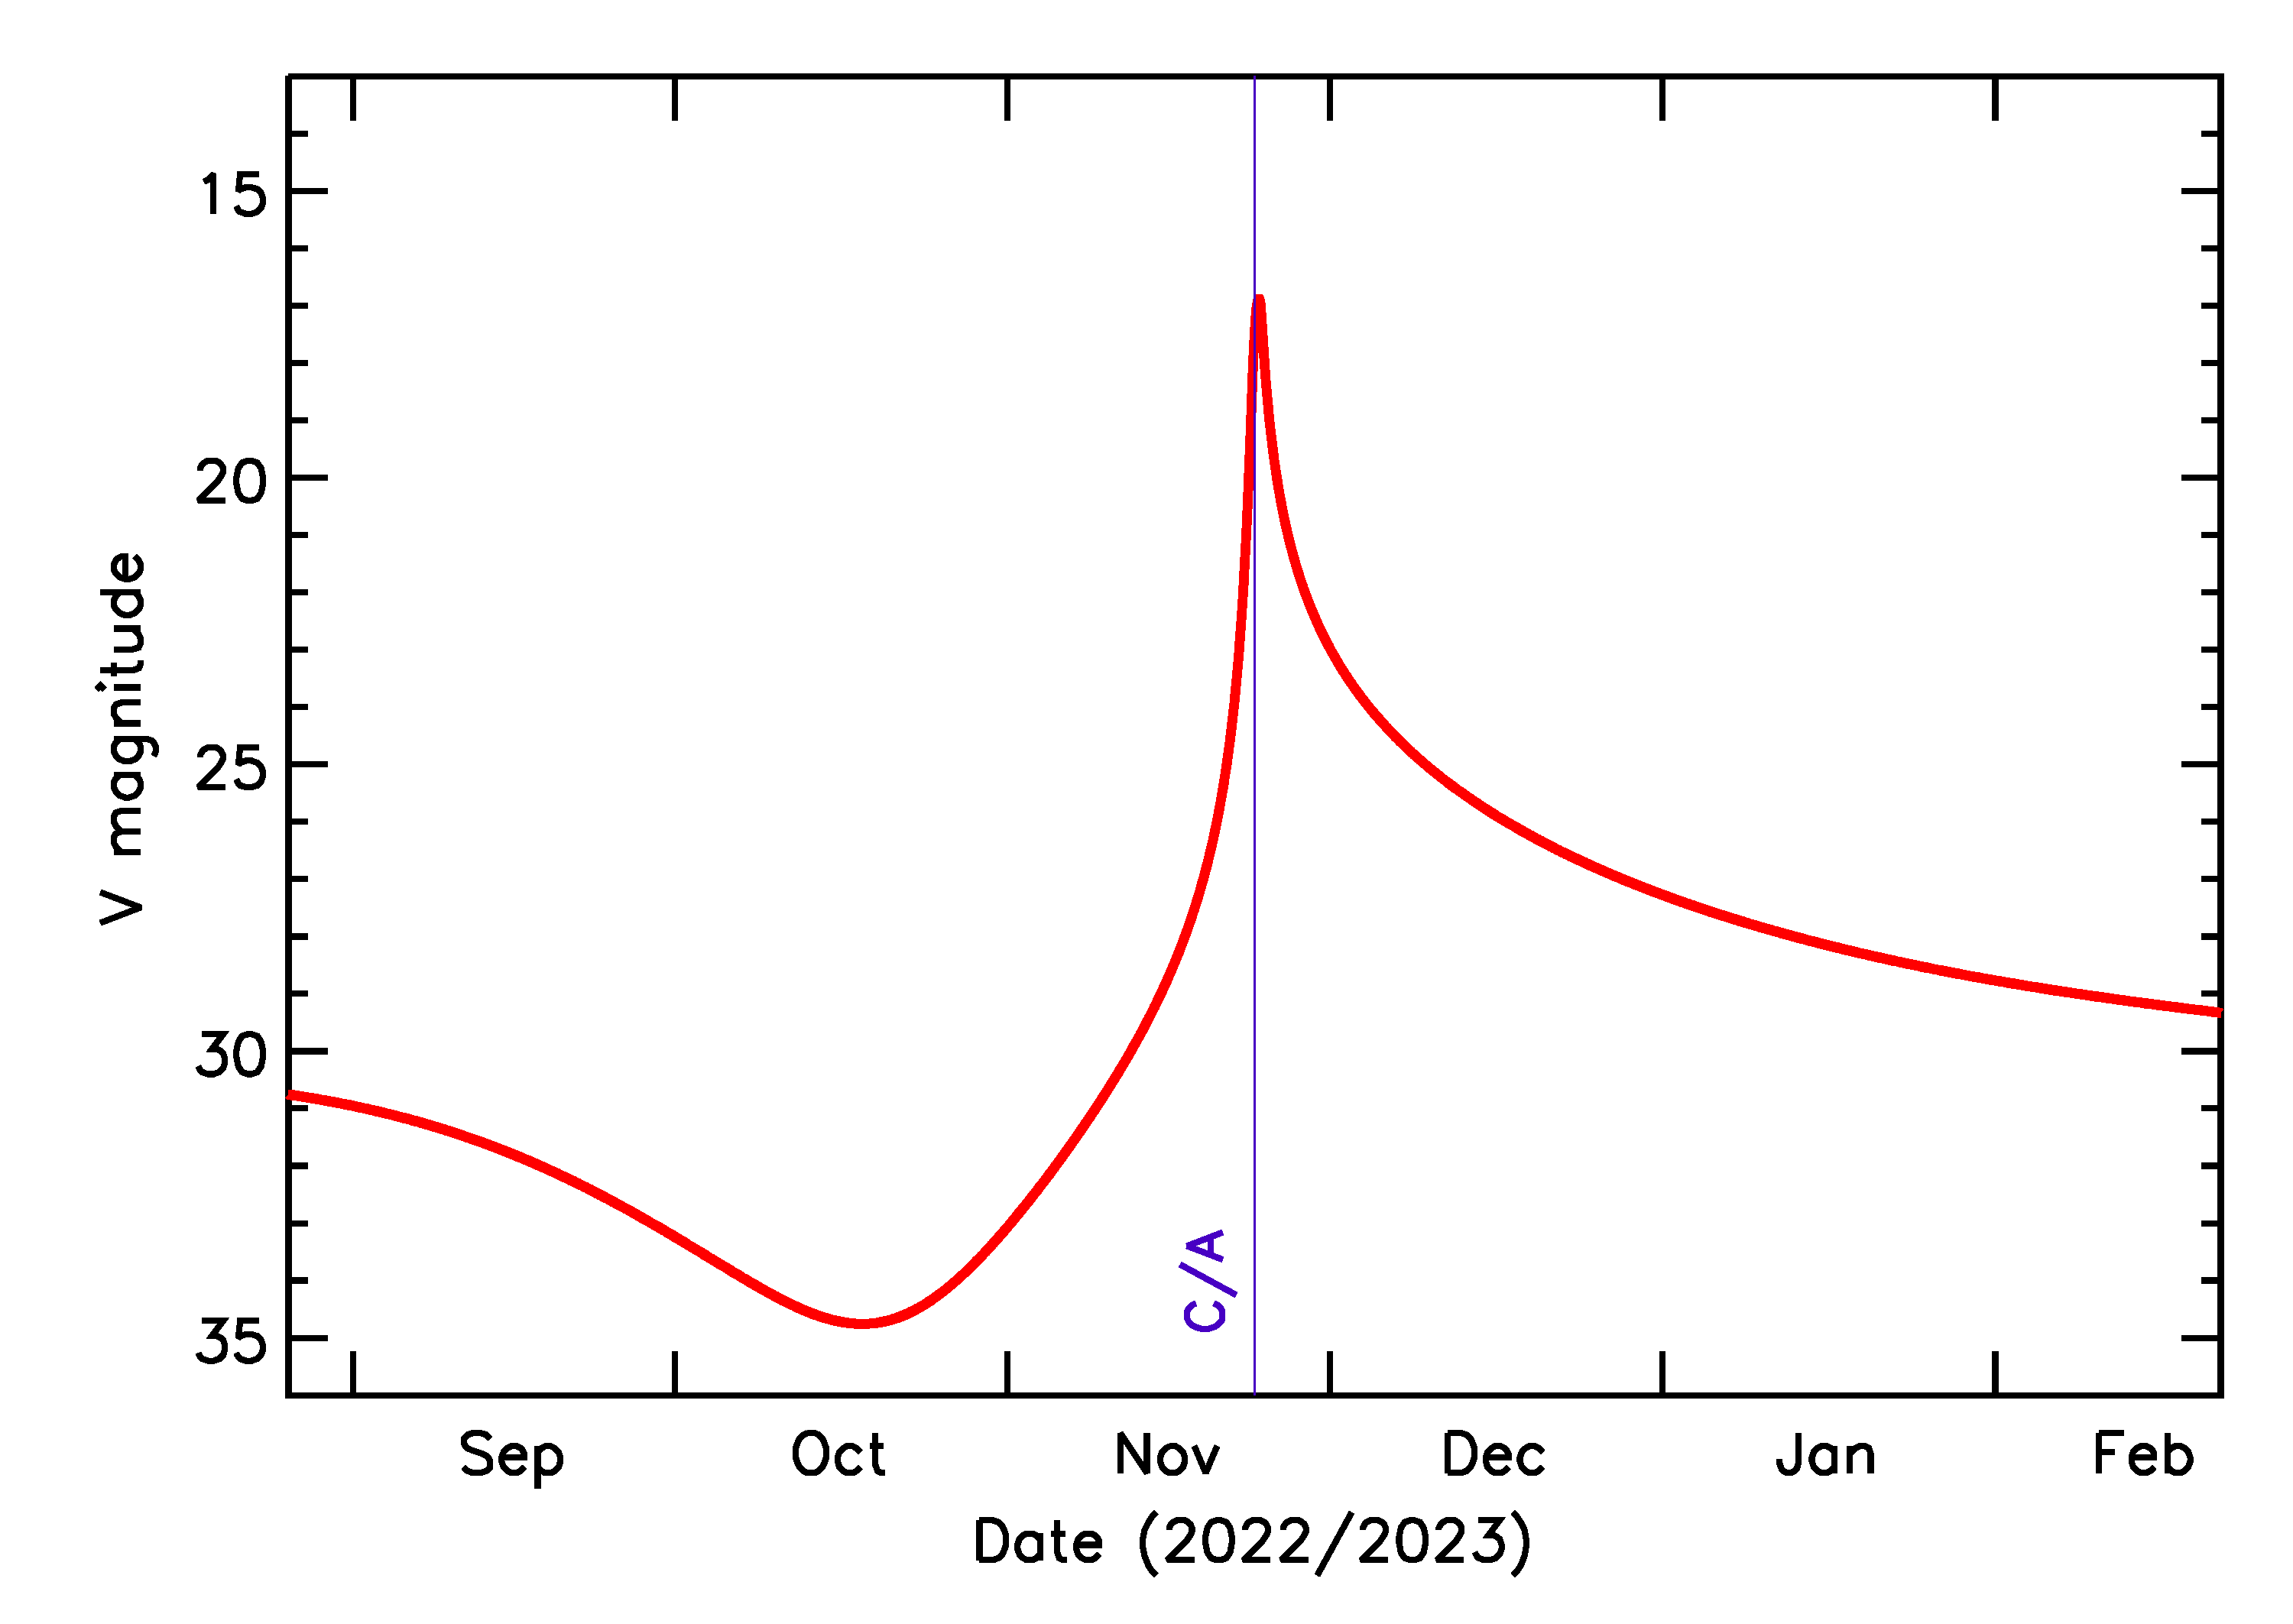
Predicted Brightness of 2022 WO6 in the months around closest approach
Solar Elongation and Solar Phase Angle
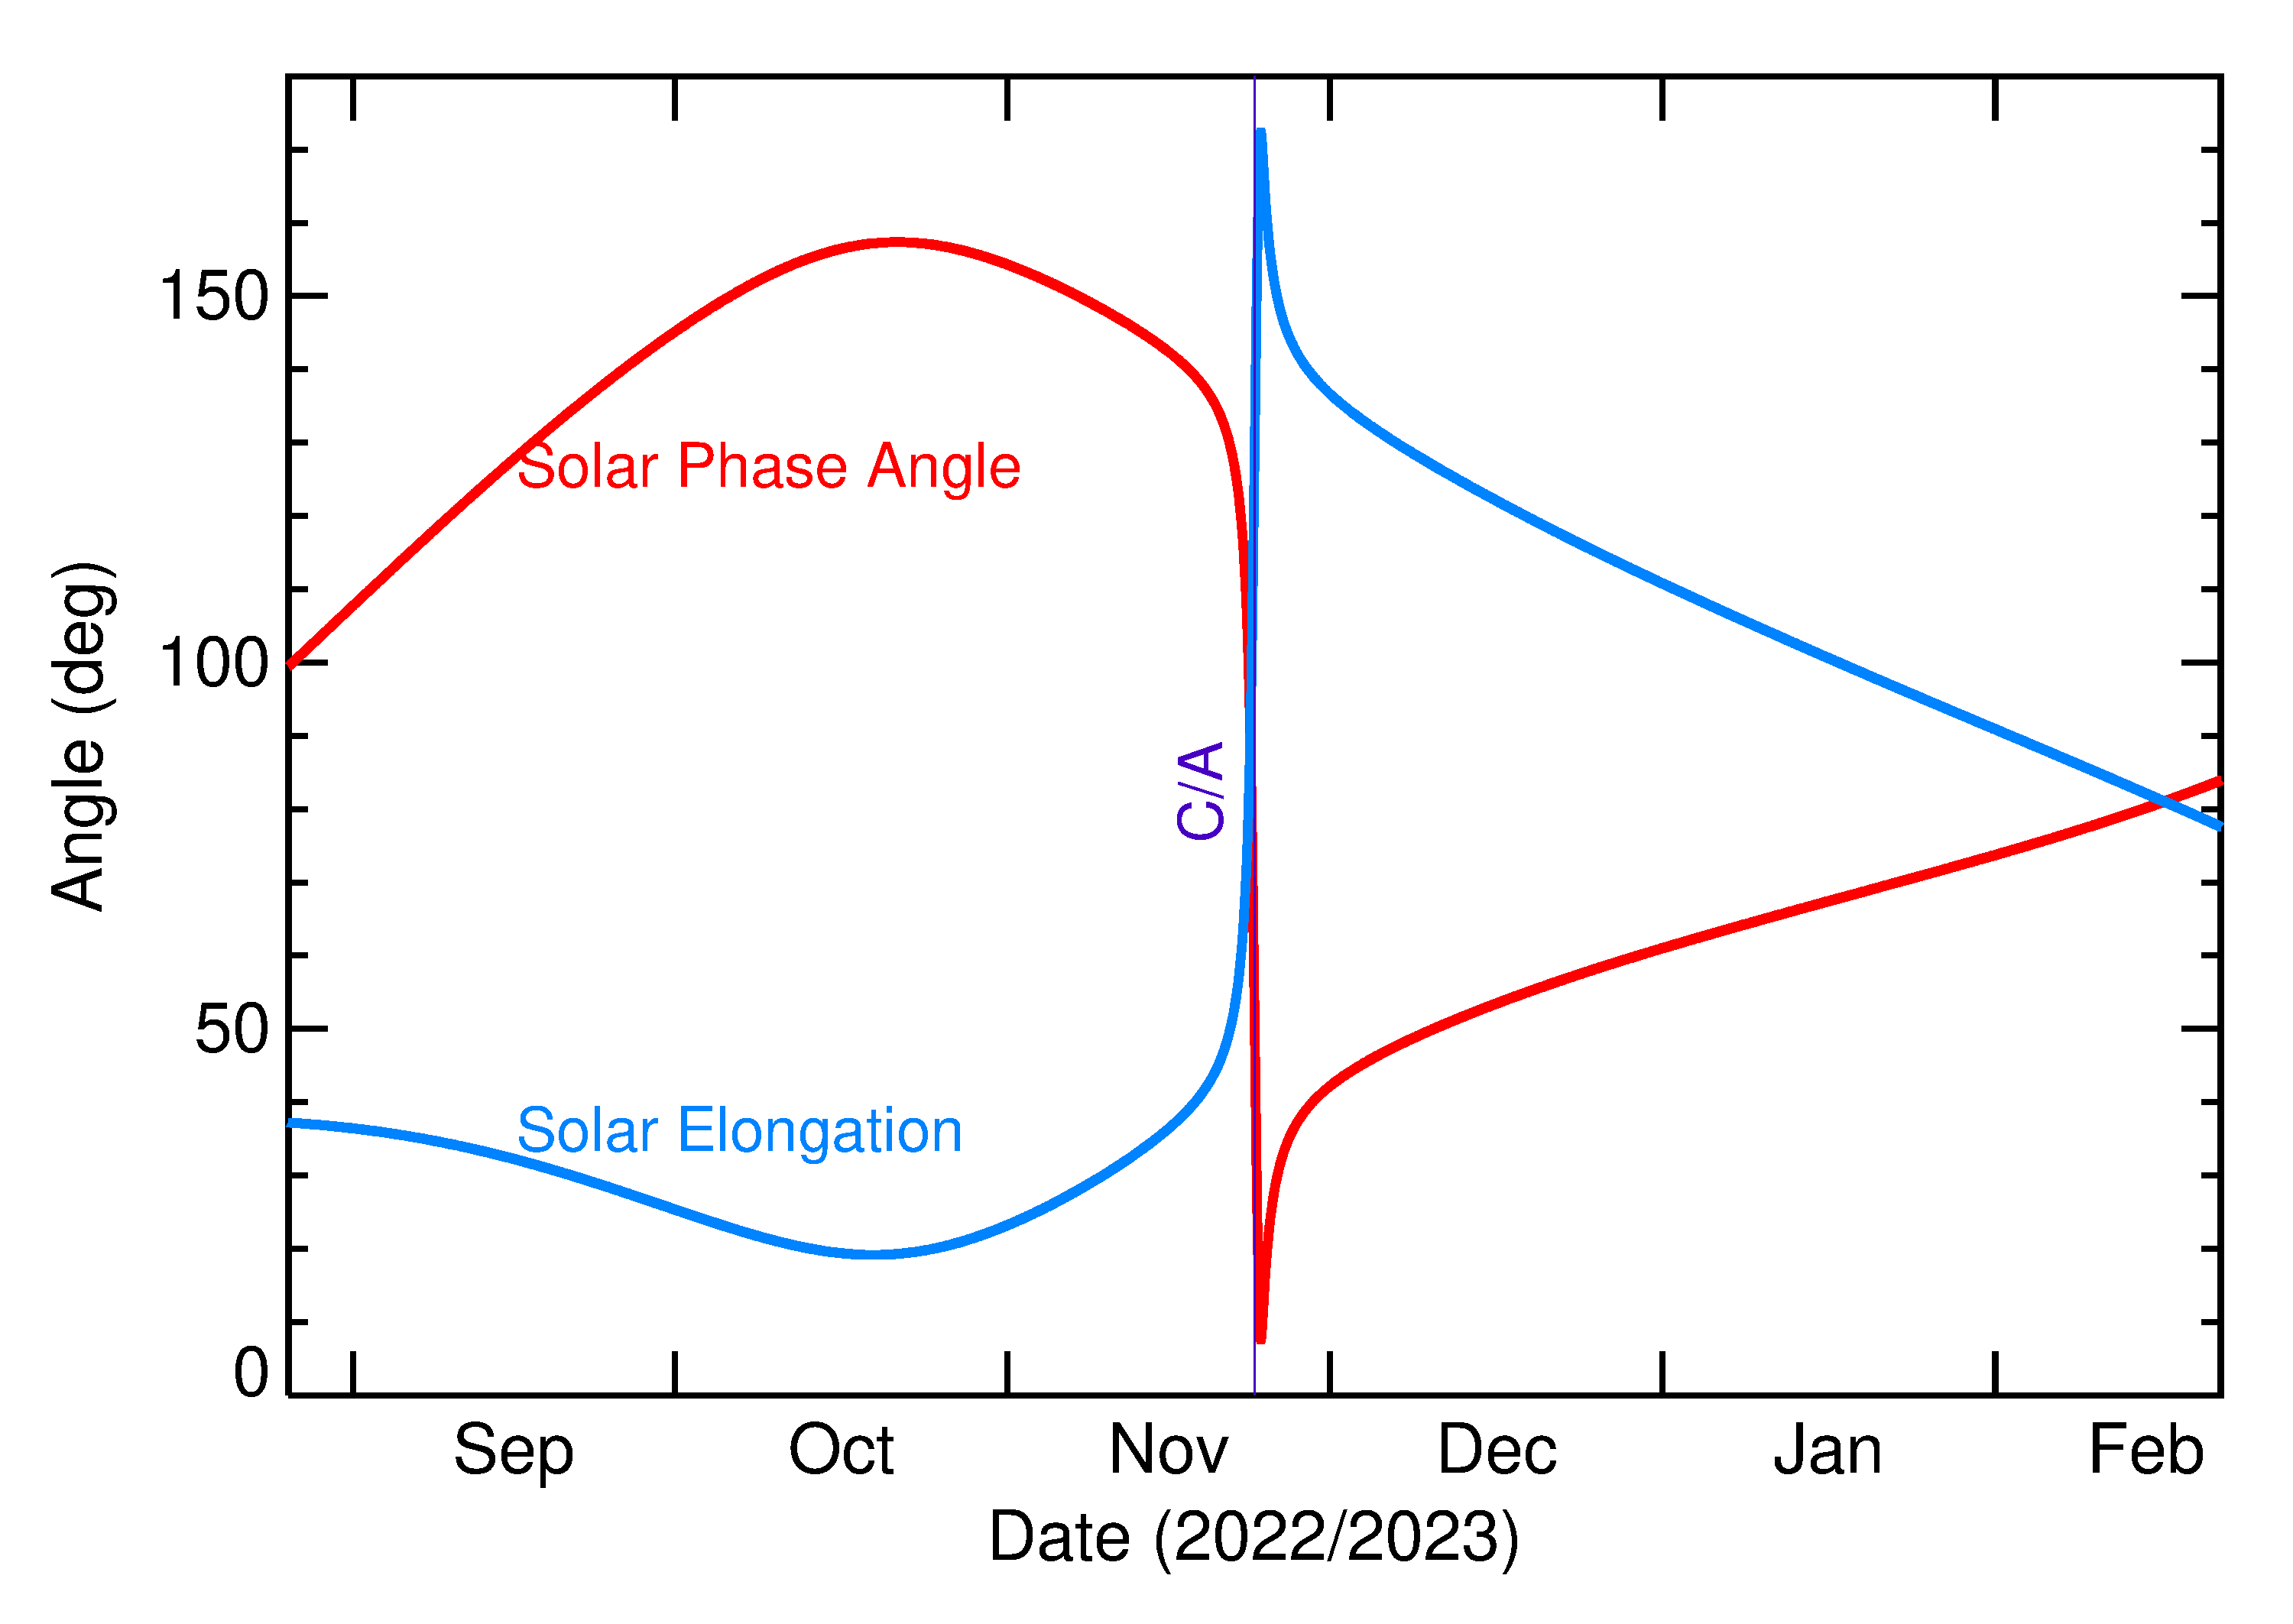
Solar Elongation and Solar Phase Angle of 2022 WO6 in the months around closest approach
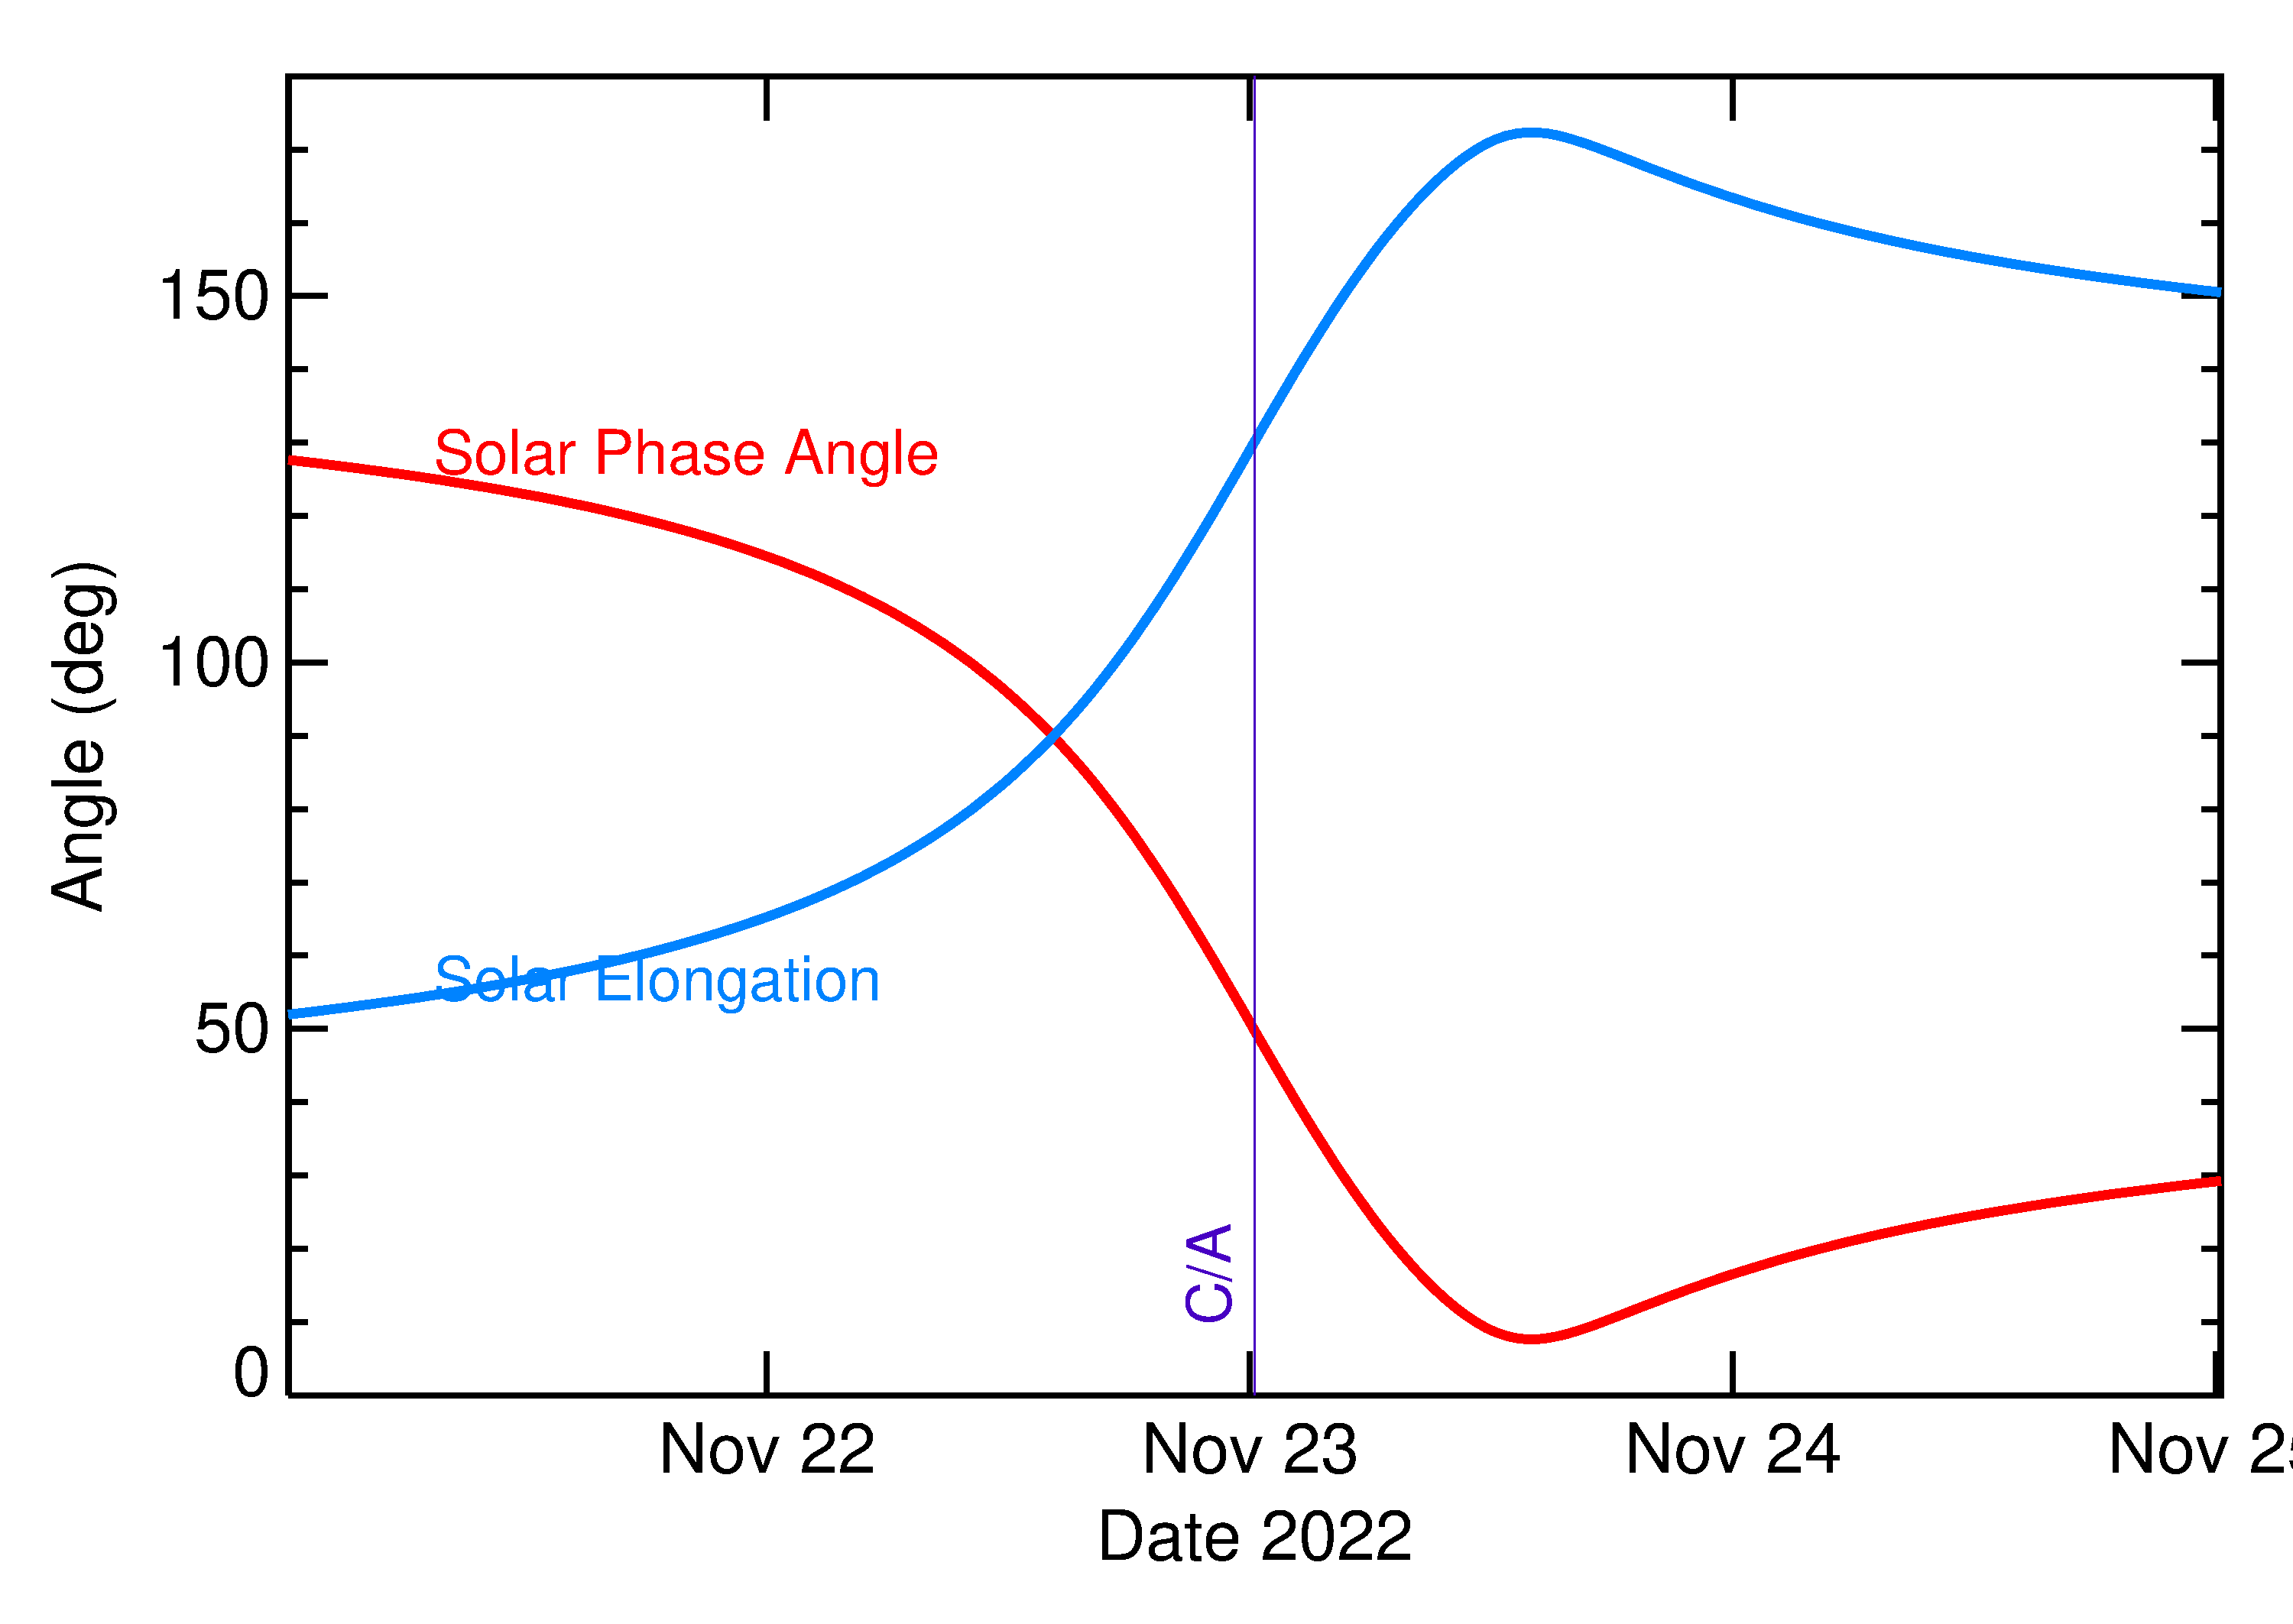
Solar Elongation and Solar Phase Angle of 2022 WO6 in the days around closest approach
Proper Motion
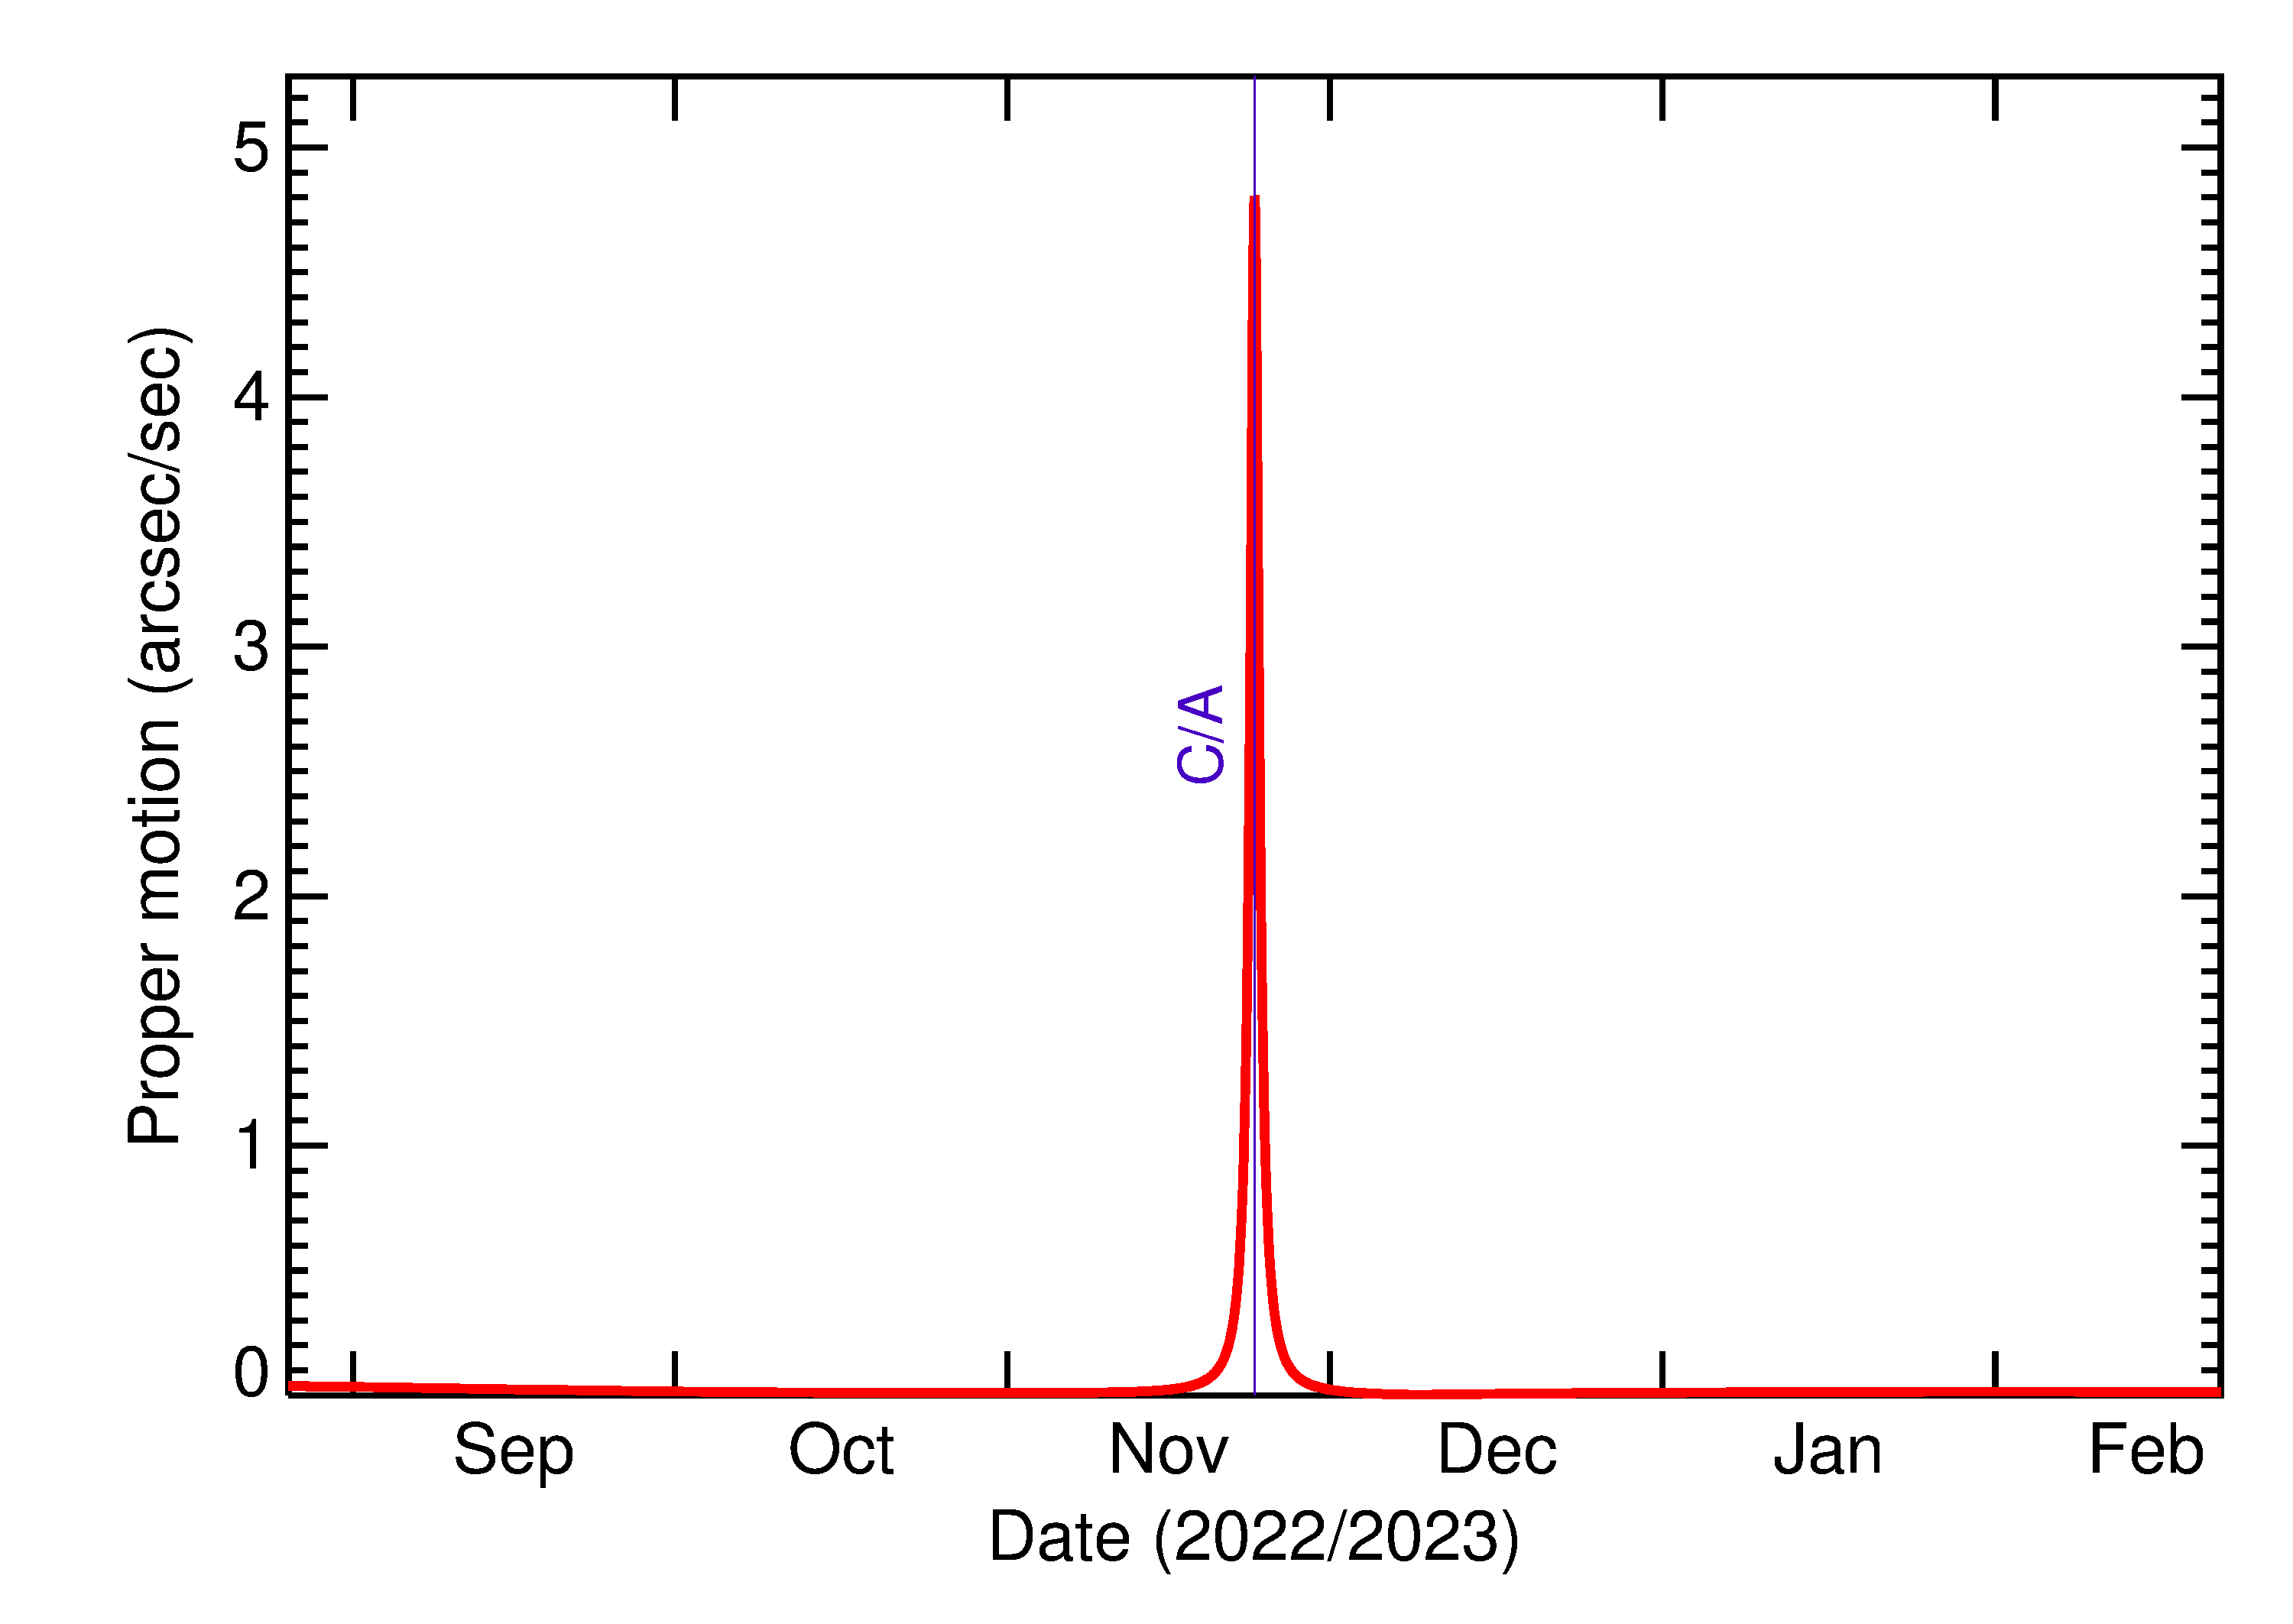
Proper motion rate of 2022 WO6 in the months around closest approach
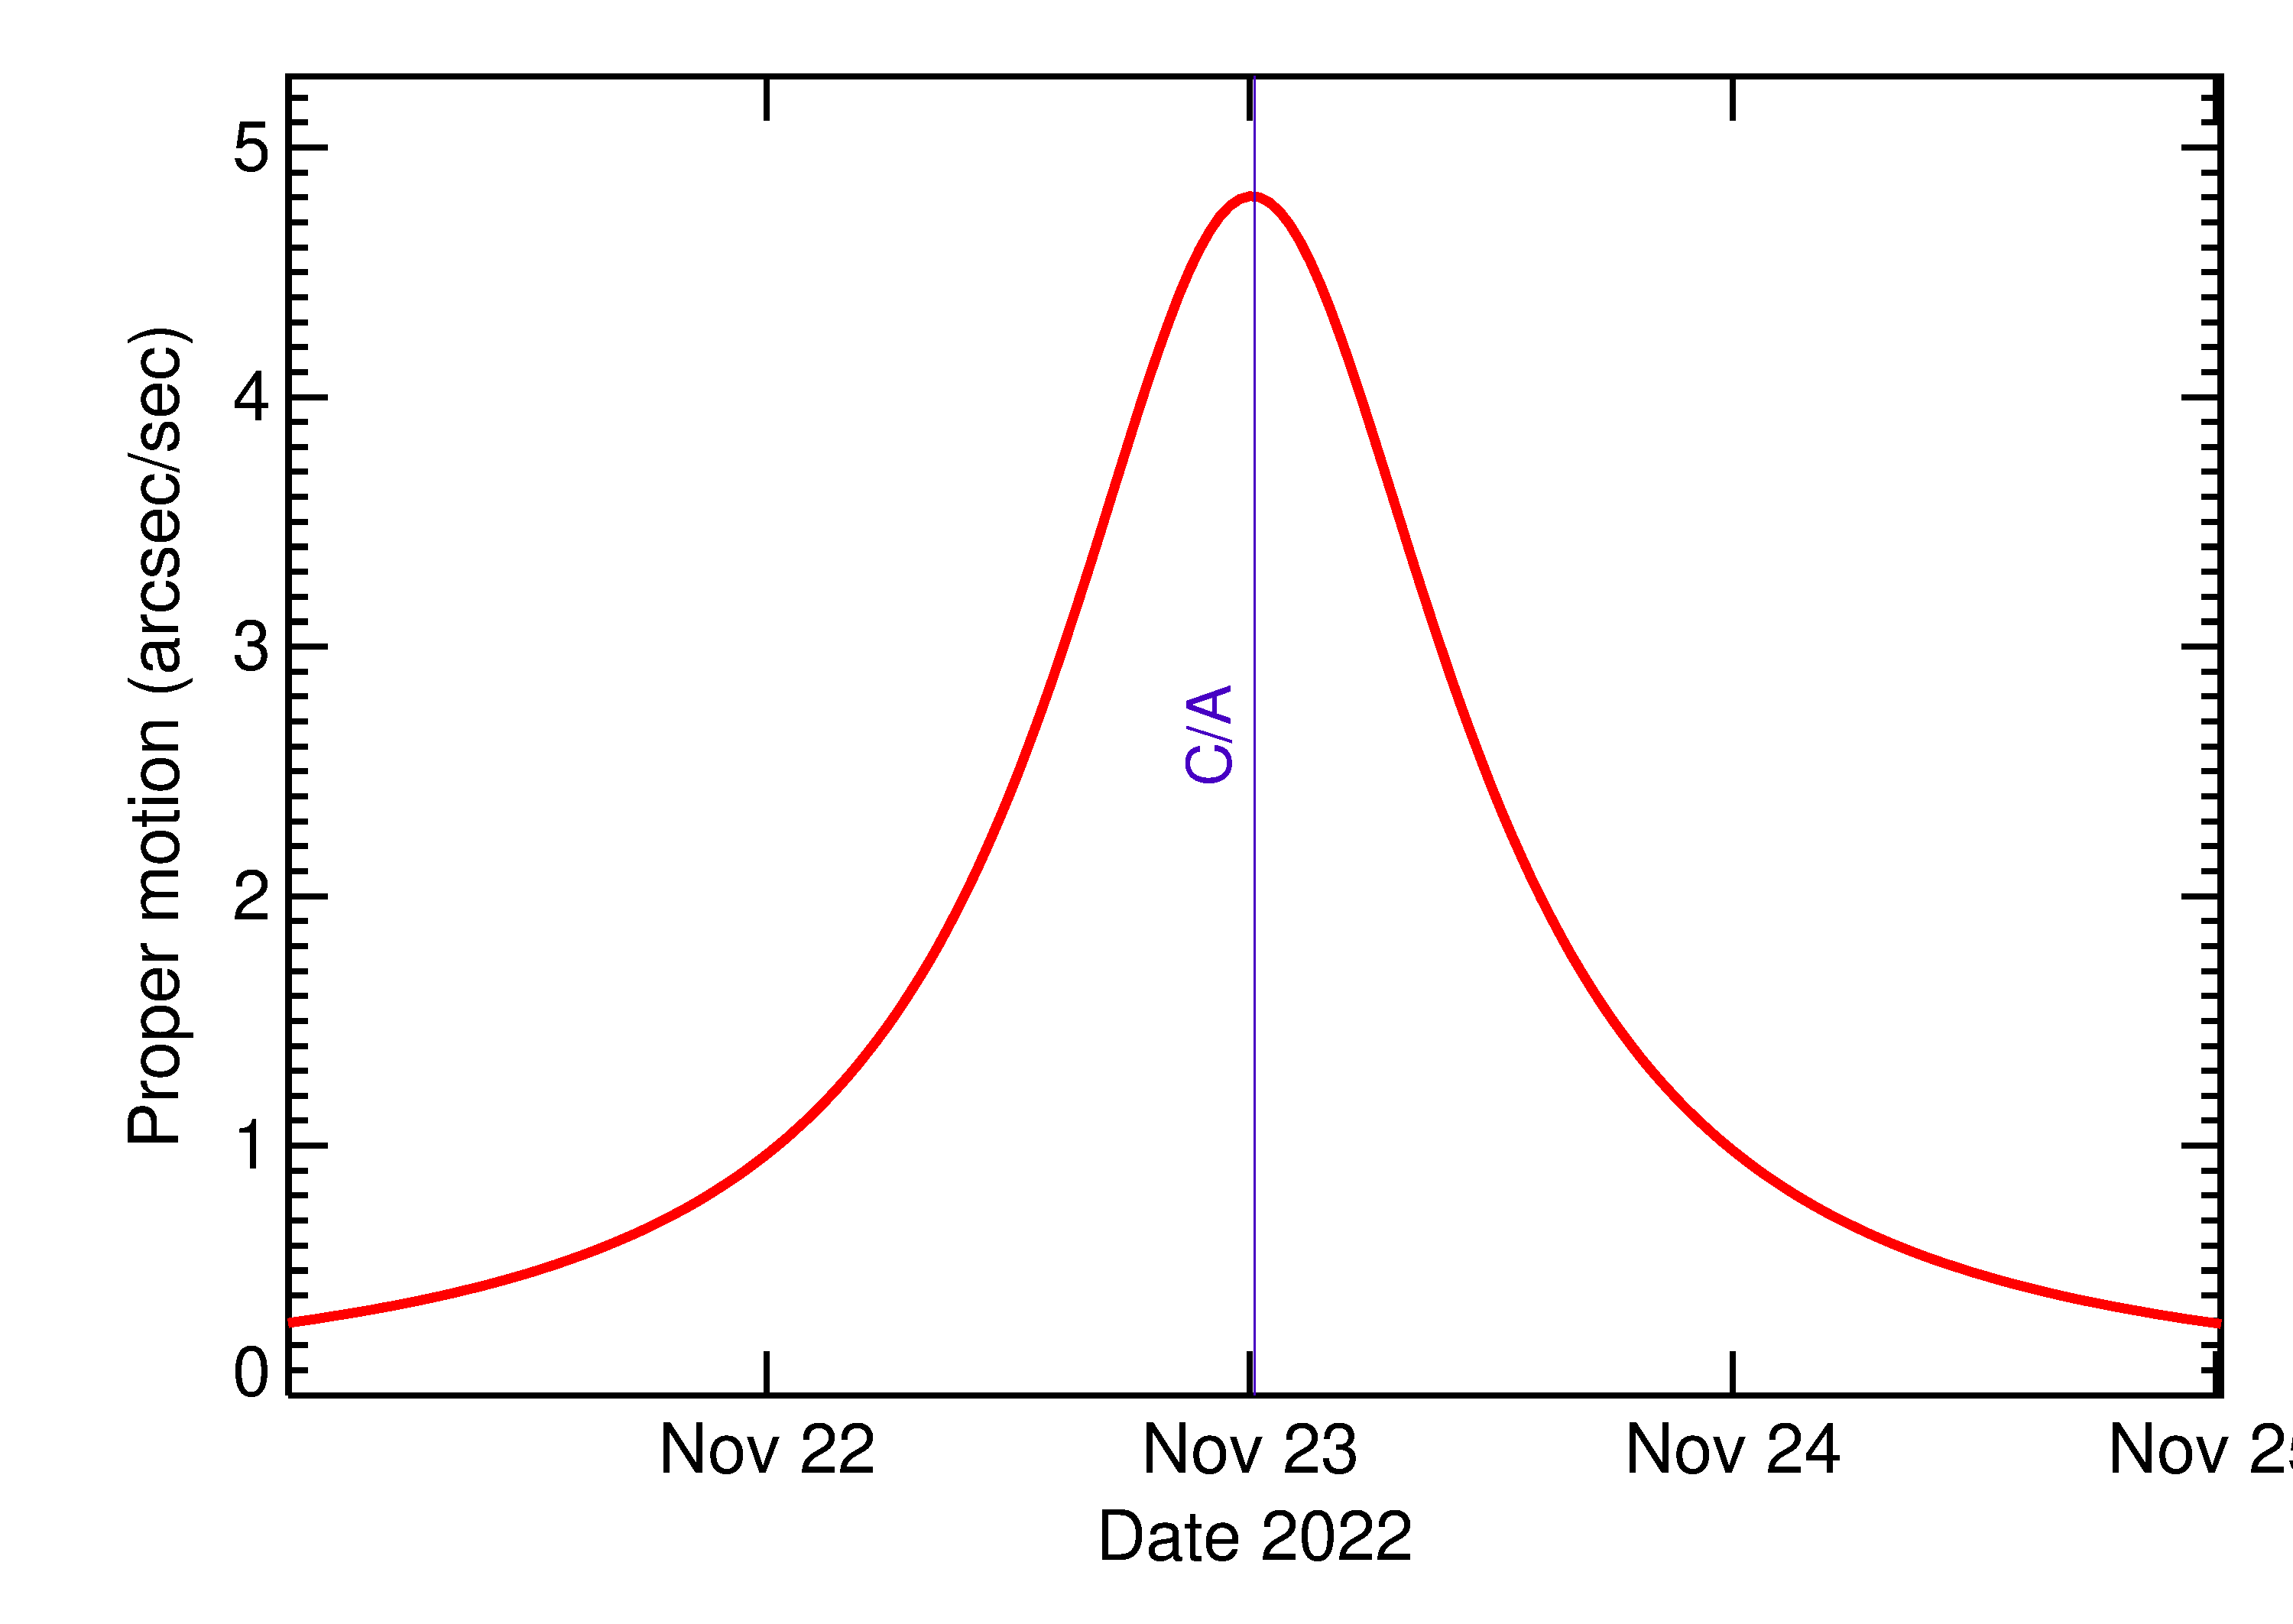
Proper motion rate of 2022 WO6 in the days around closest approach
True Anomaly
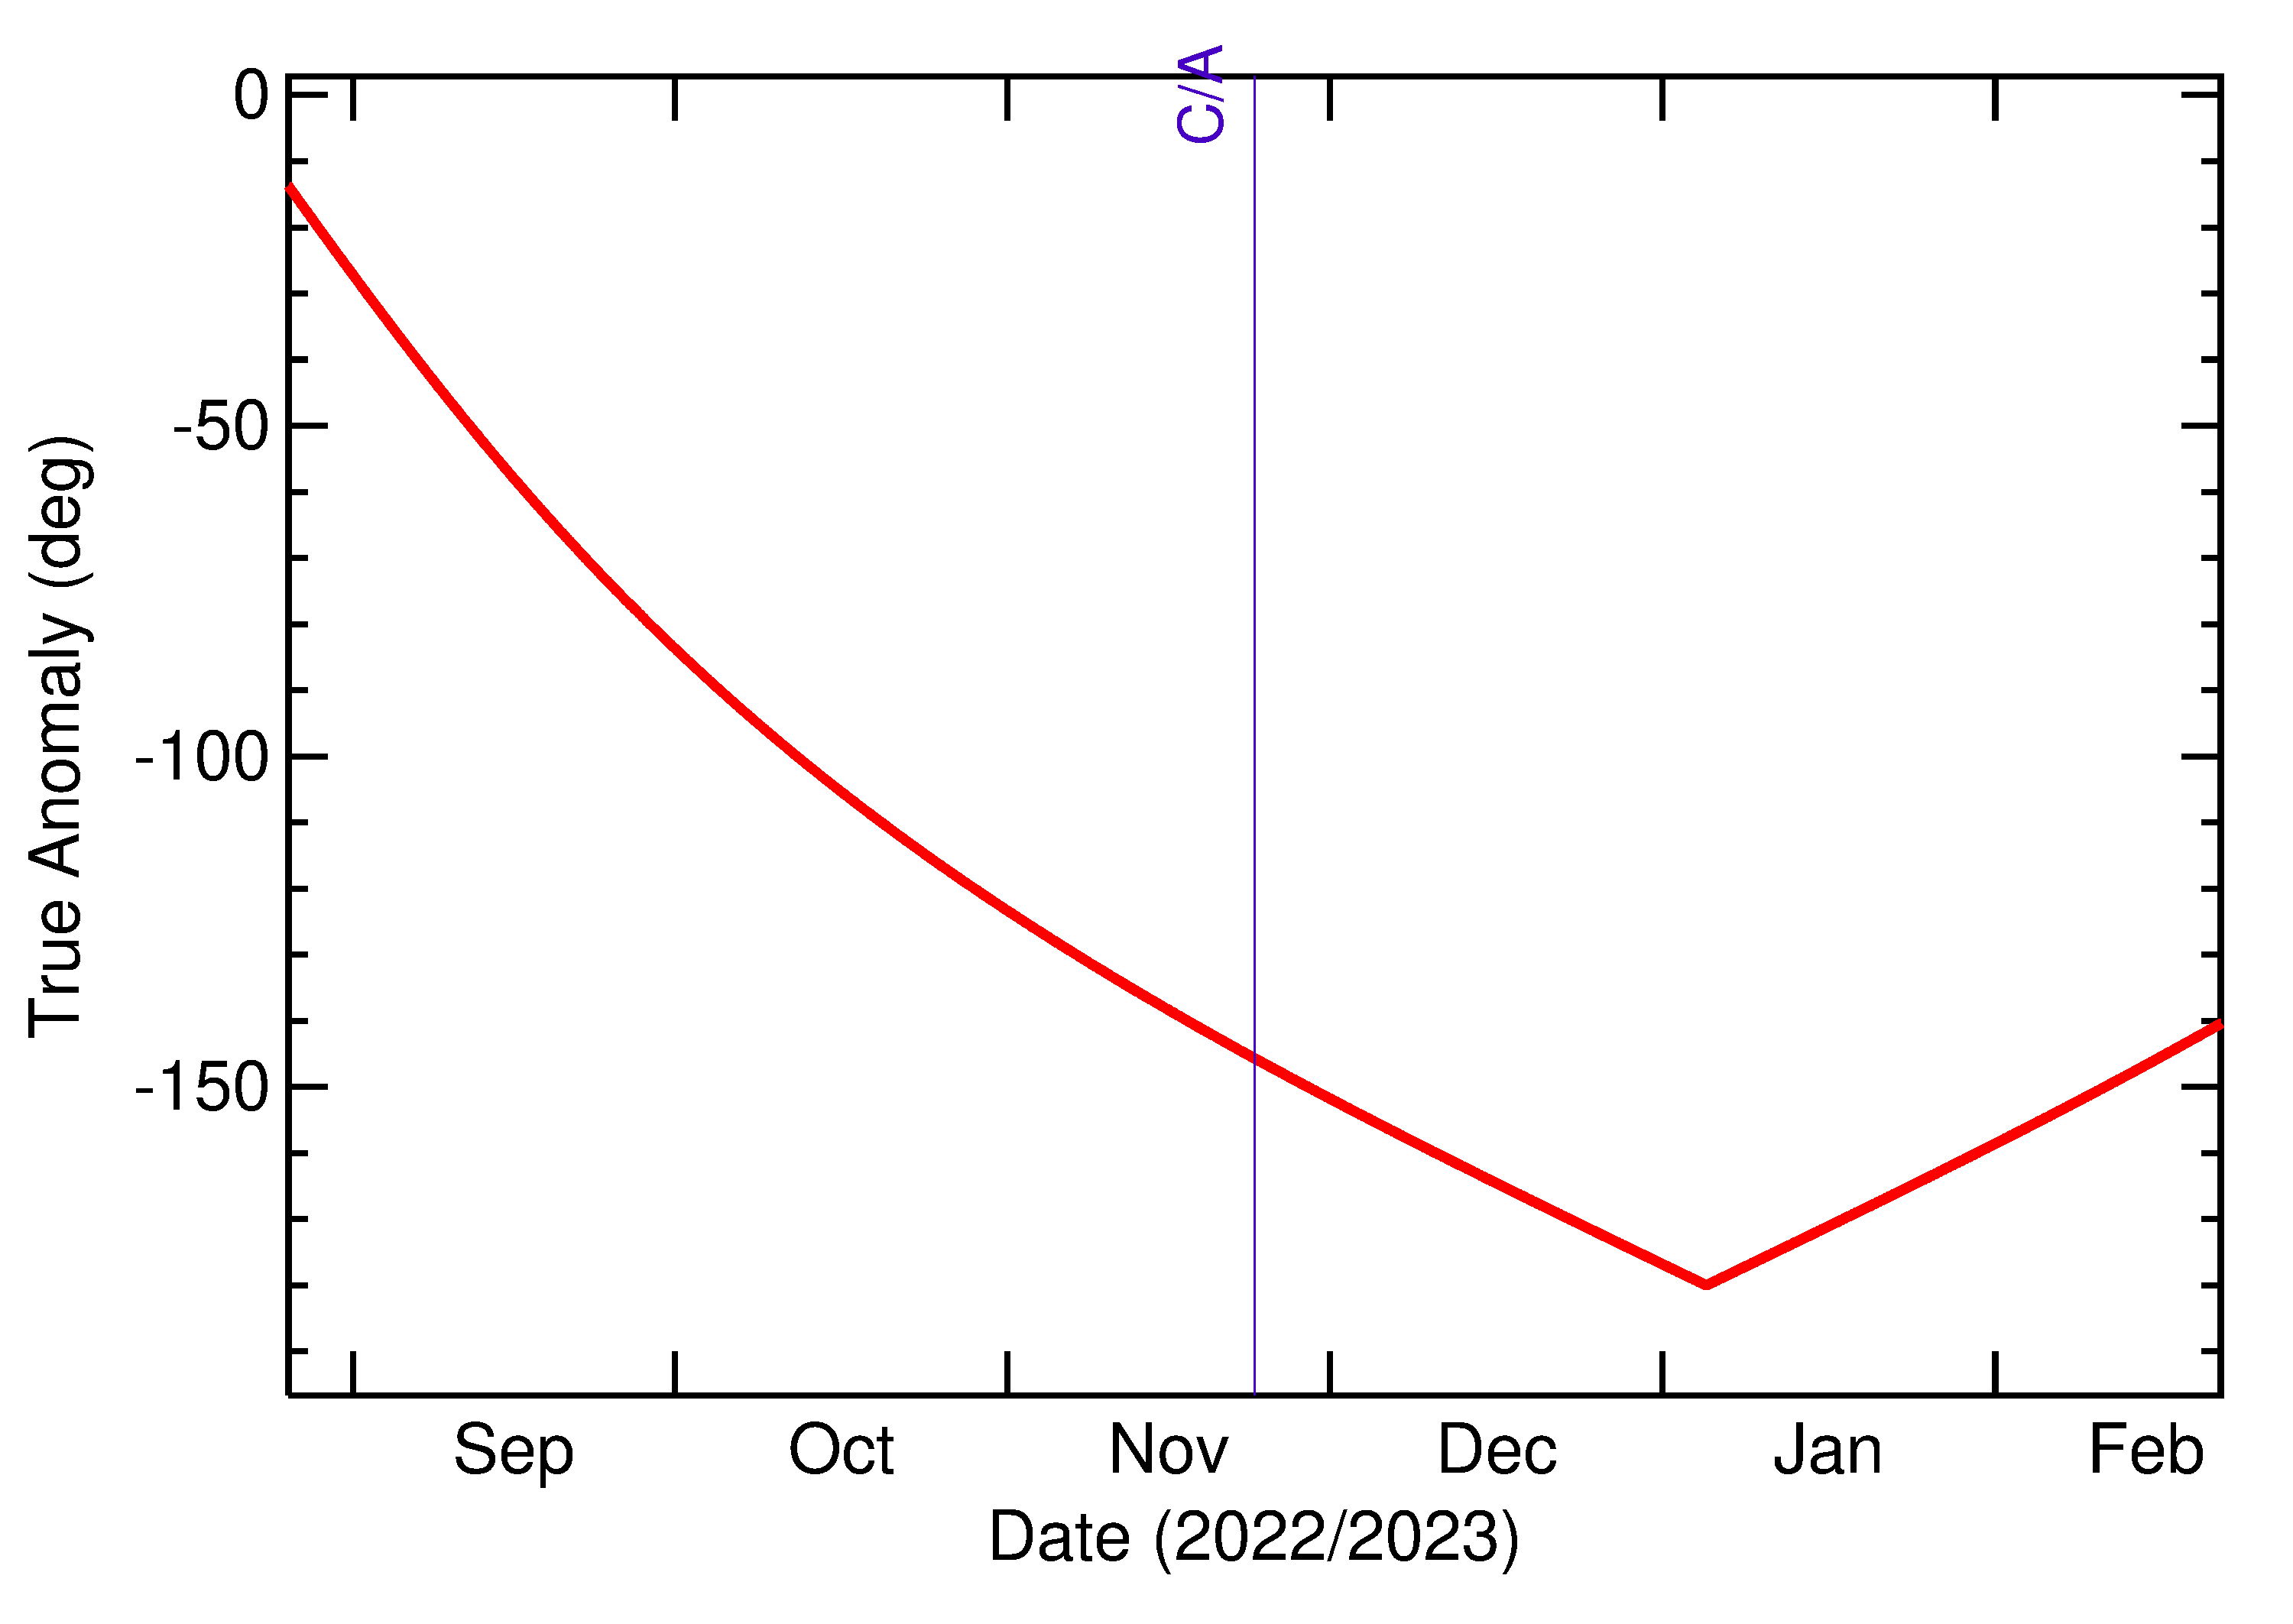
Orbital true anomaly of 2022 WO6 in the months around closest approach
Near-Earth Trajectory
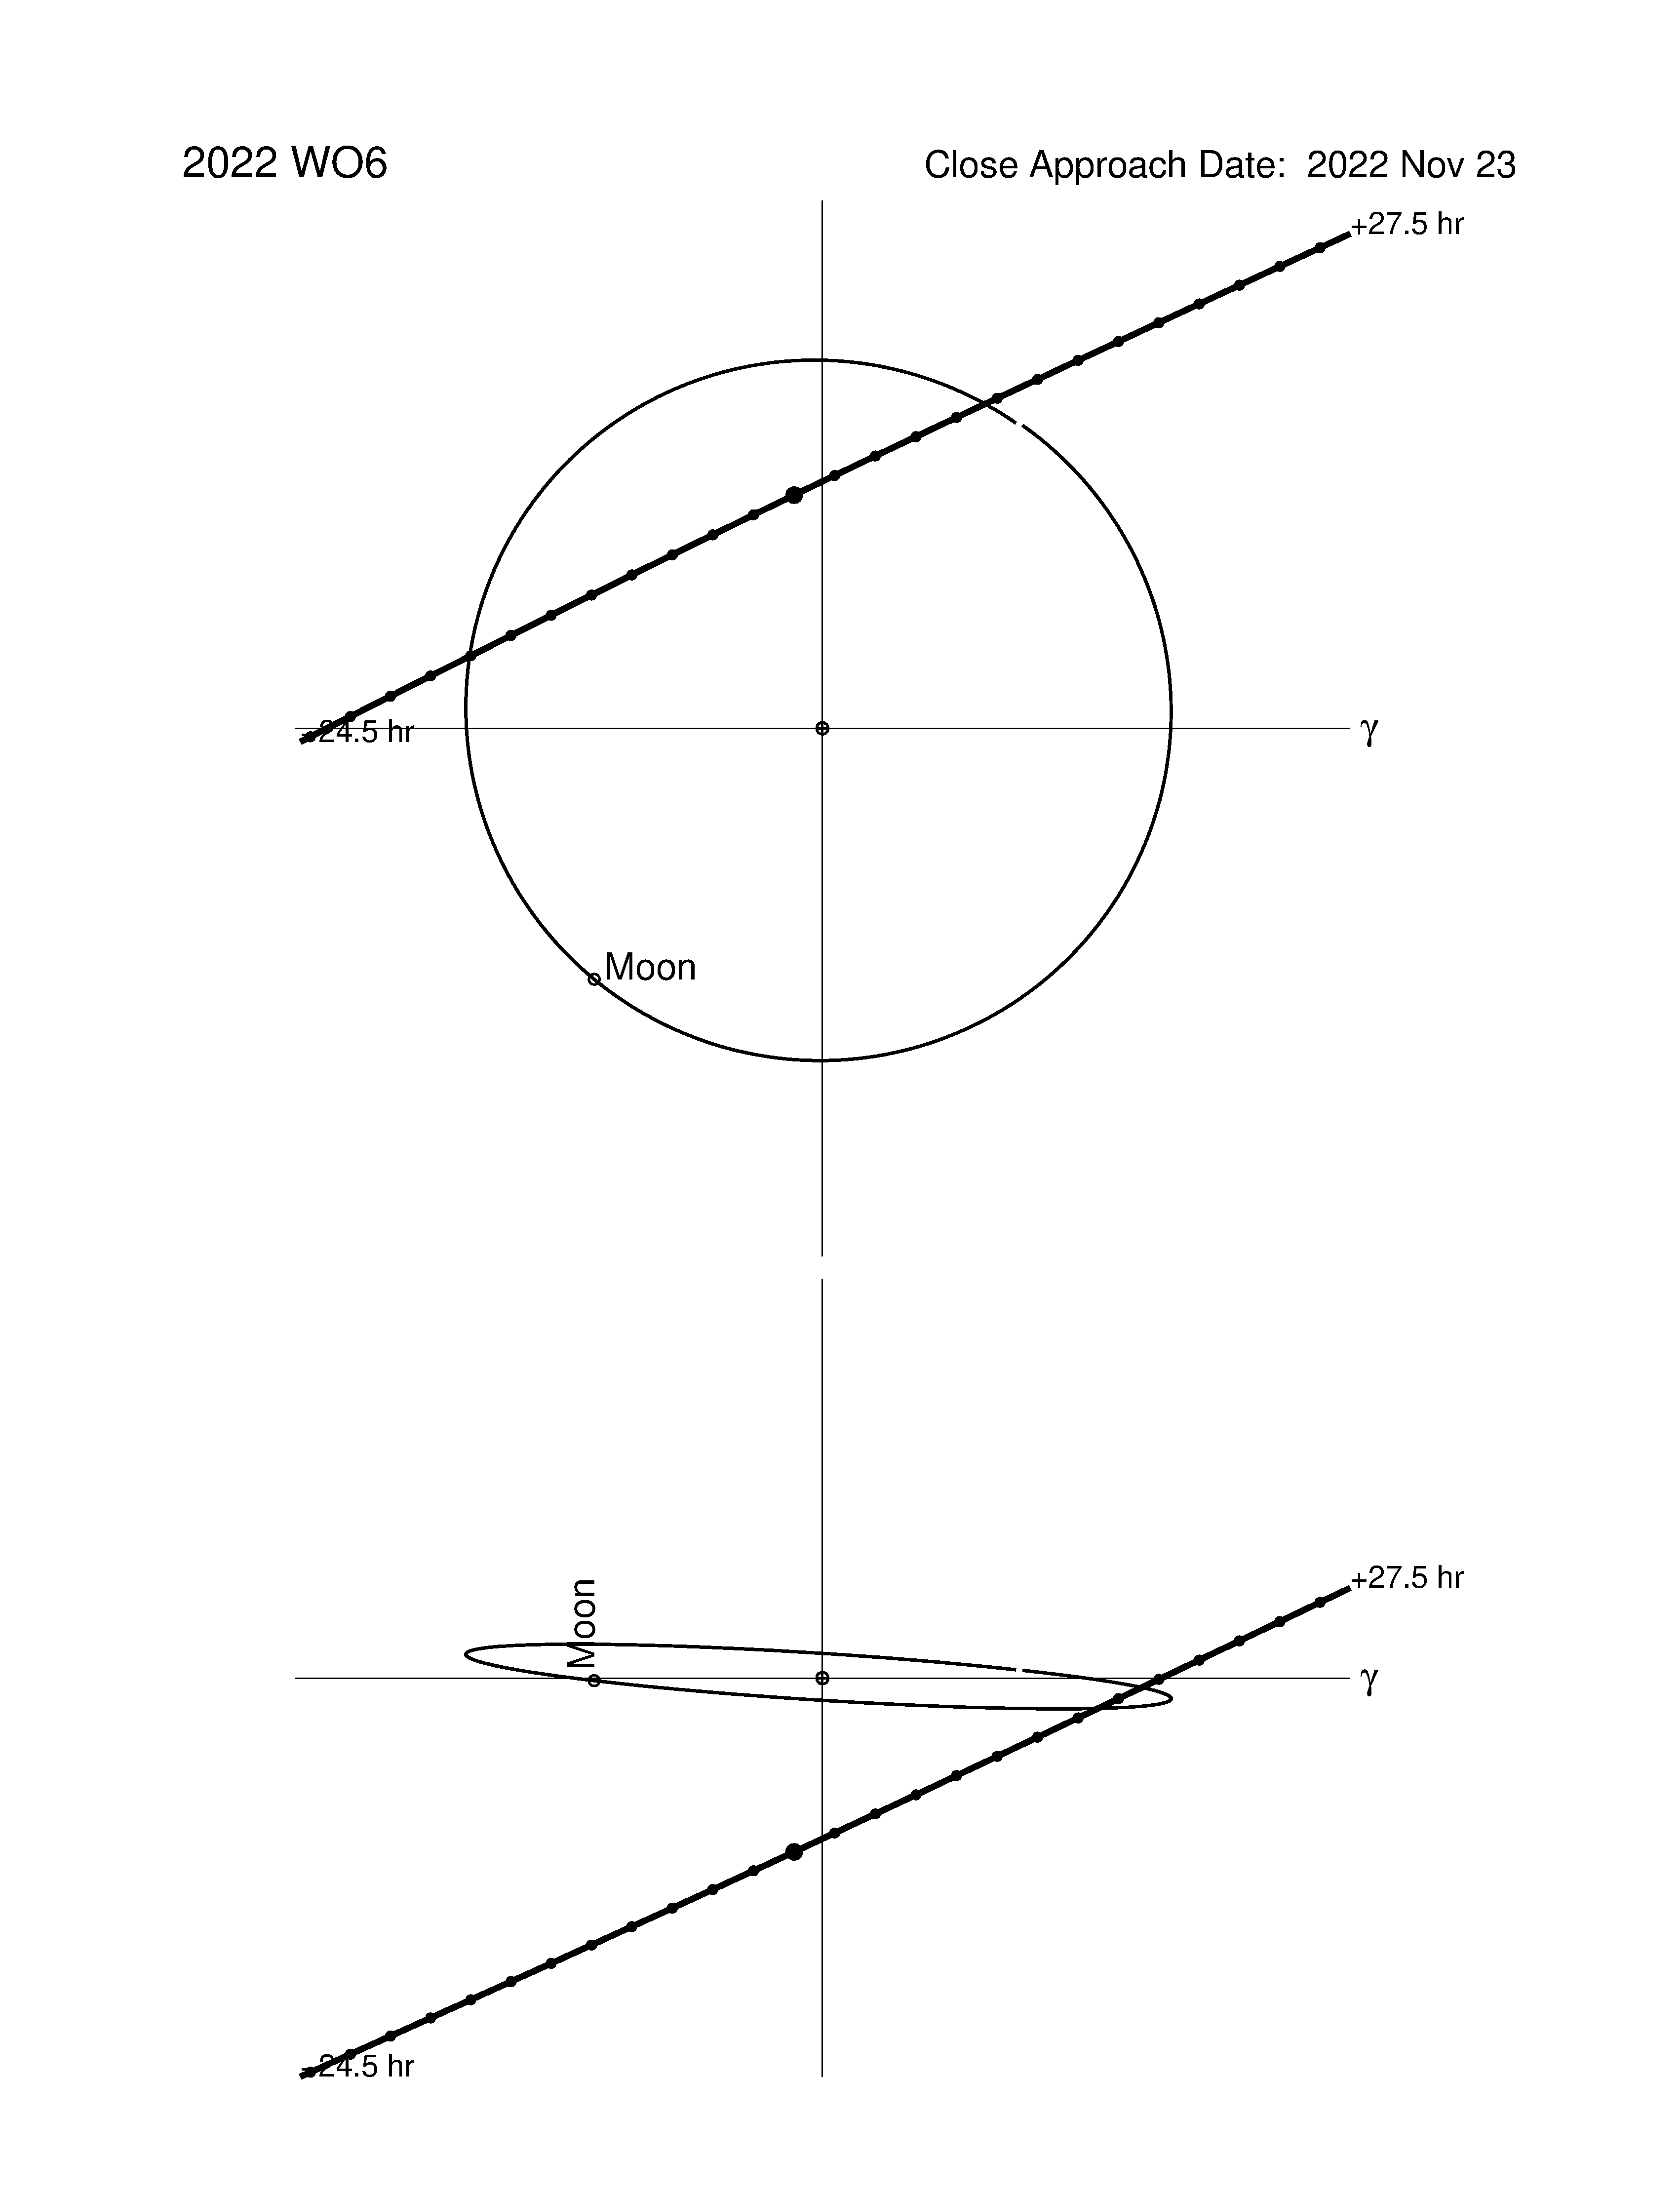
Path of 2022 WO6 in the Near-Earth region, shown from above and within the ecliptic plane. The large dot denotes the point of closest approach to the Earth, with tick marks every 2 hours. The lunar orbit is also shown, with the position of the Moon at the time of closest approach.
Orbit of 2022 WO6
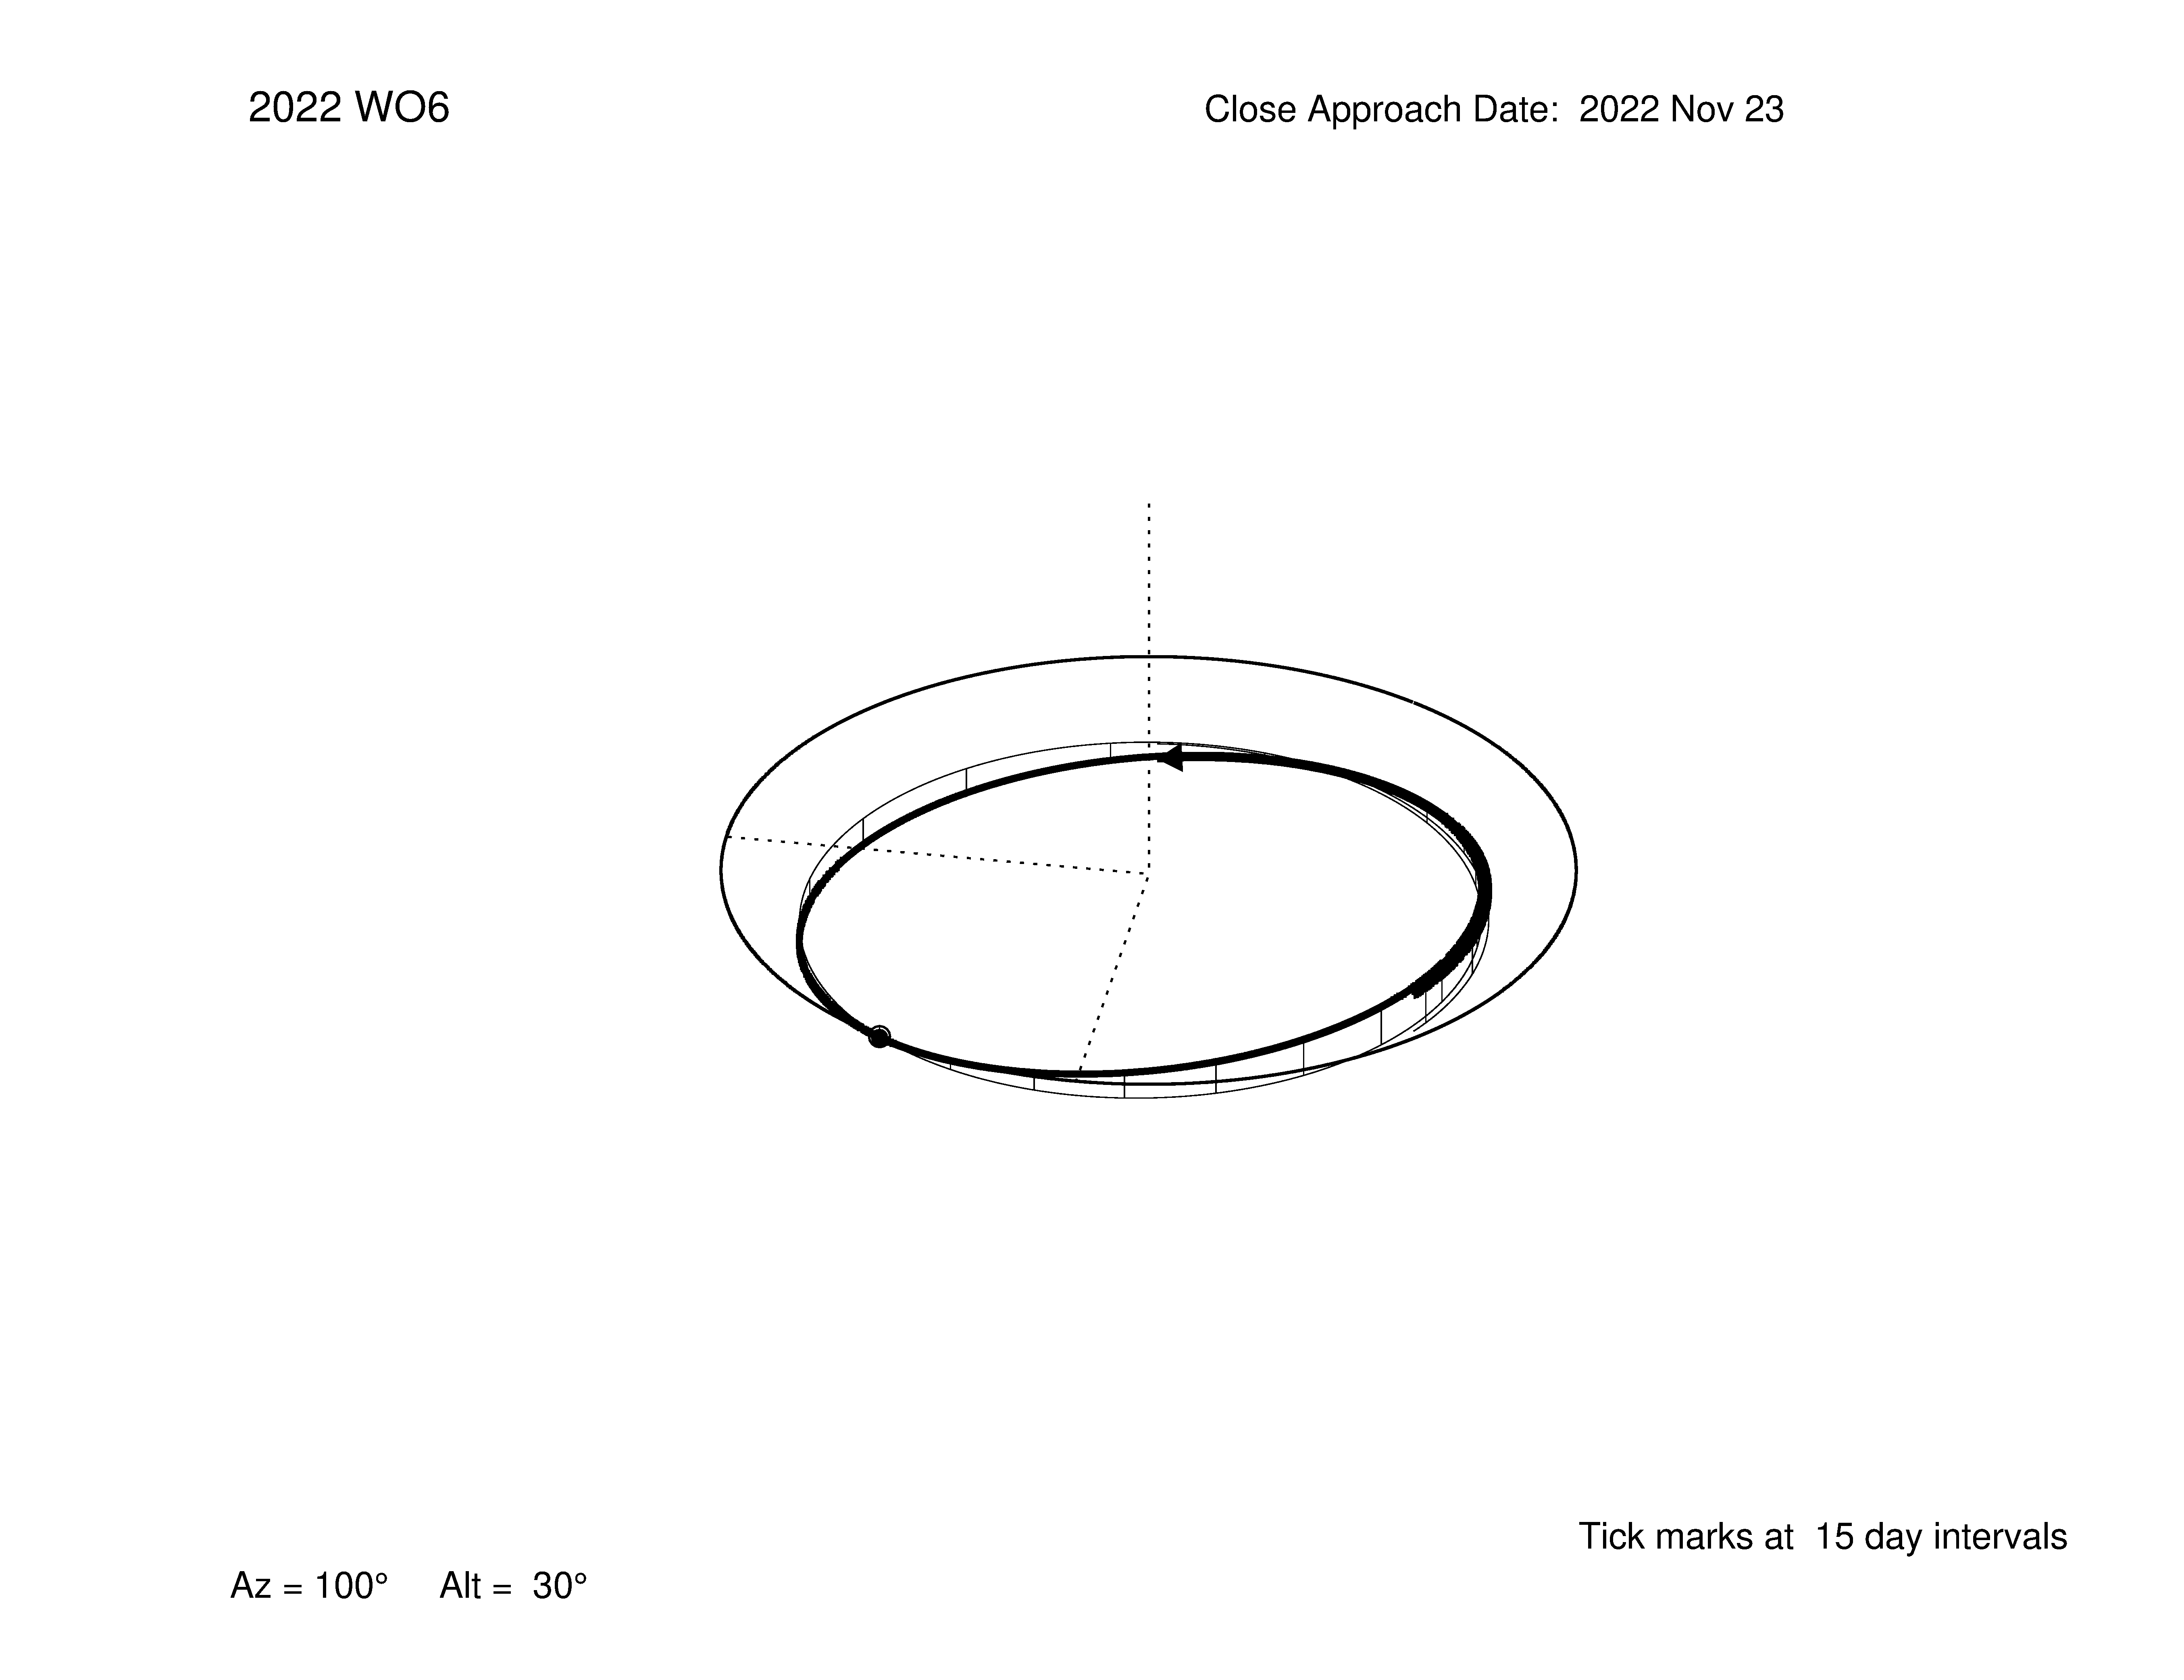
Oblique view showing the positions of the asteroid and Earth (coinciding) on the date of closest approach. The thin lines show the projection of the asteroid's orbit projected onto the ecliptic plane, with tic marks denoting 15-day intervals.
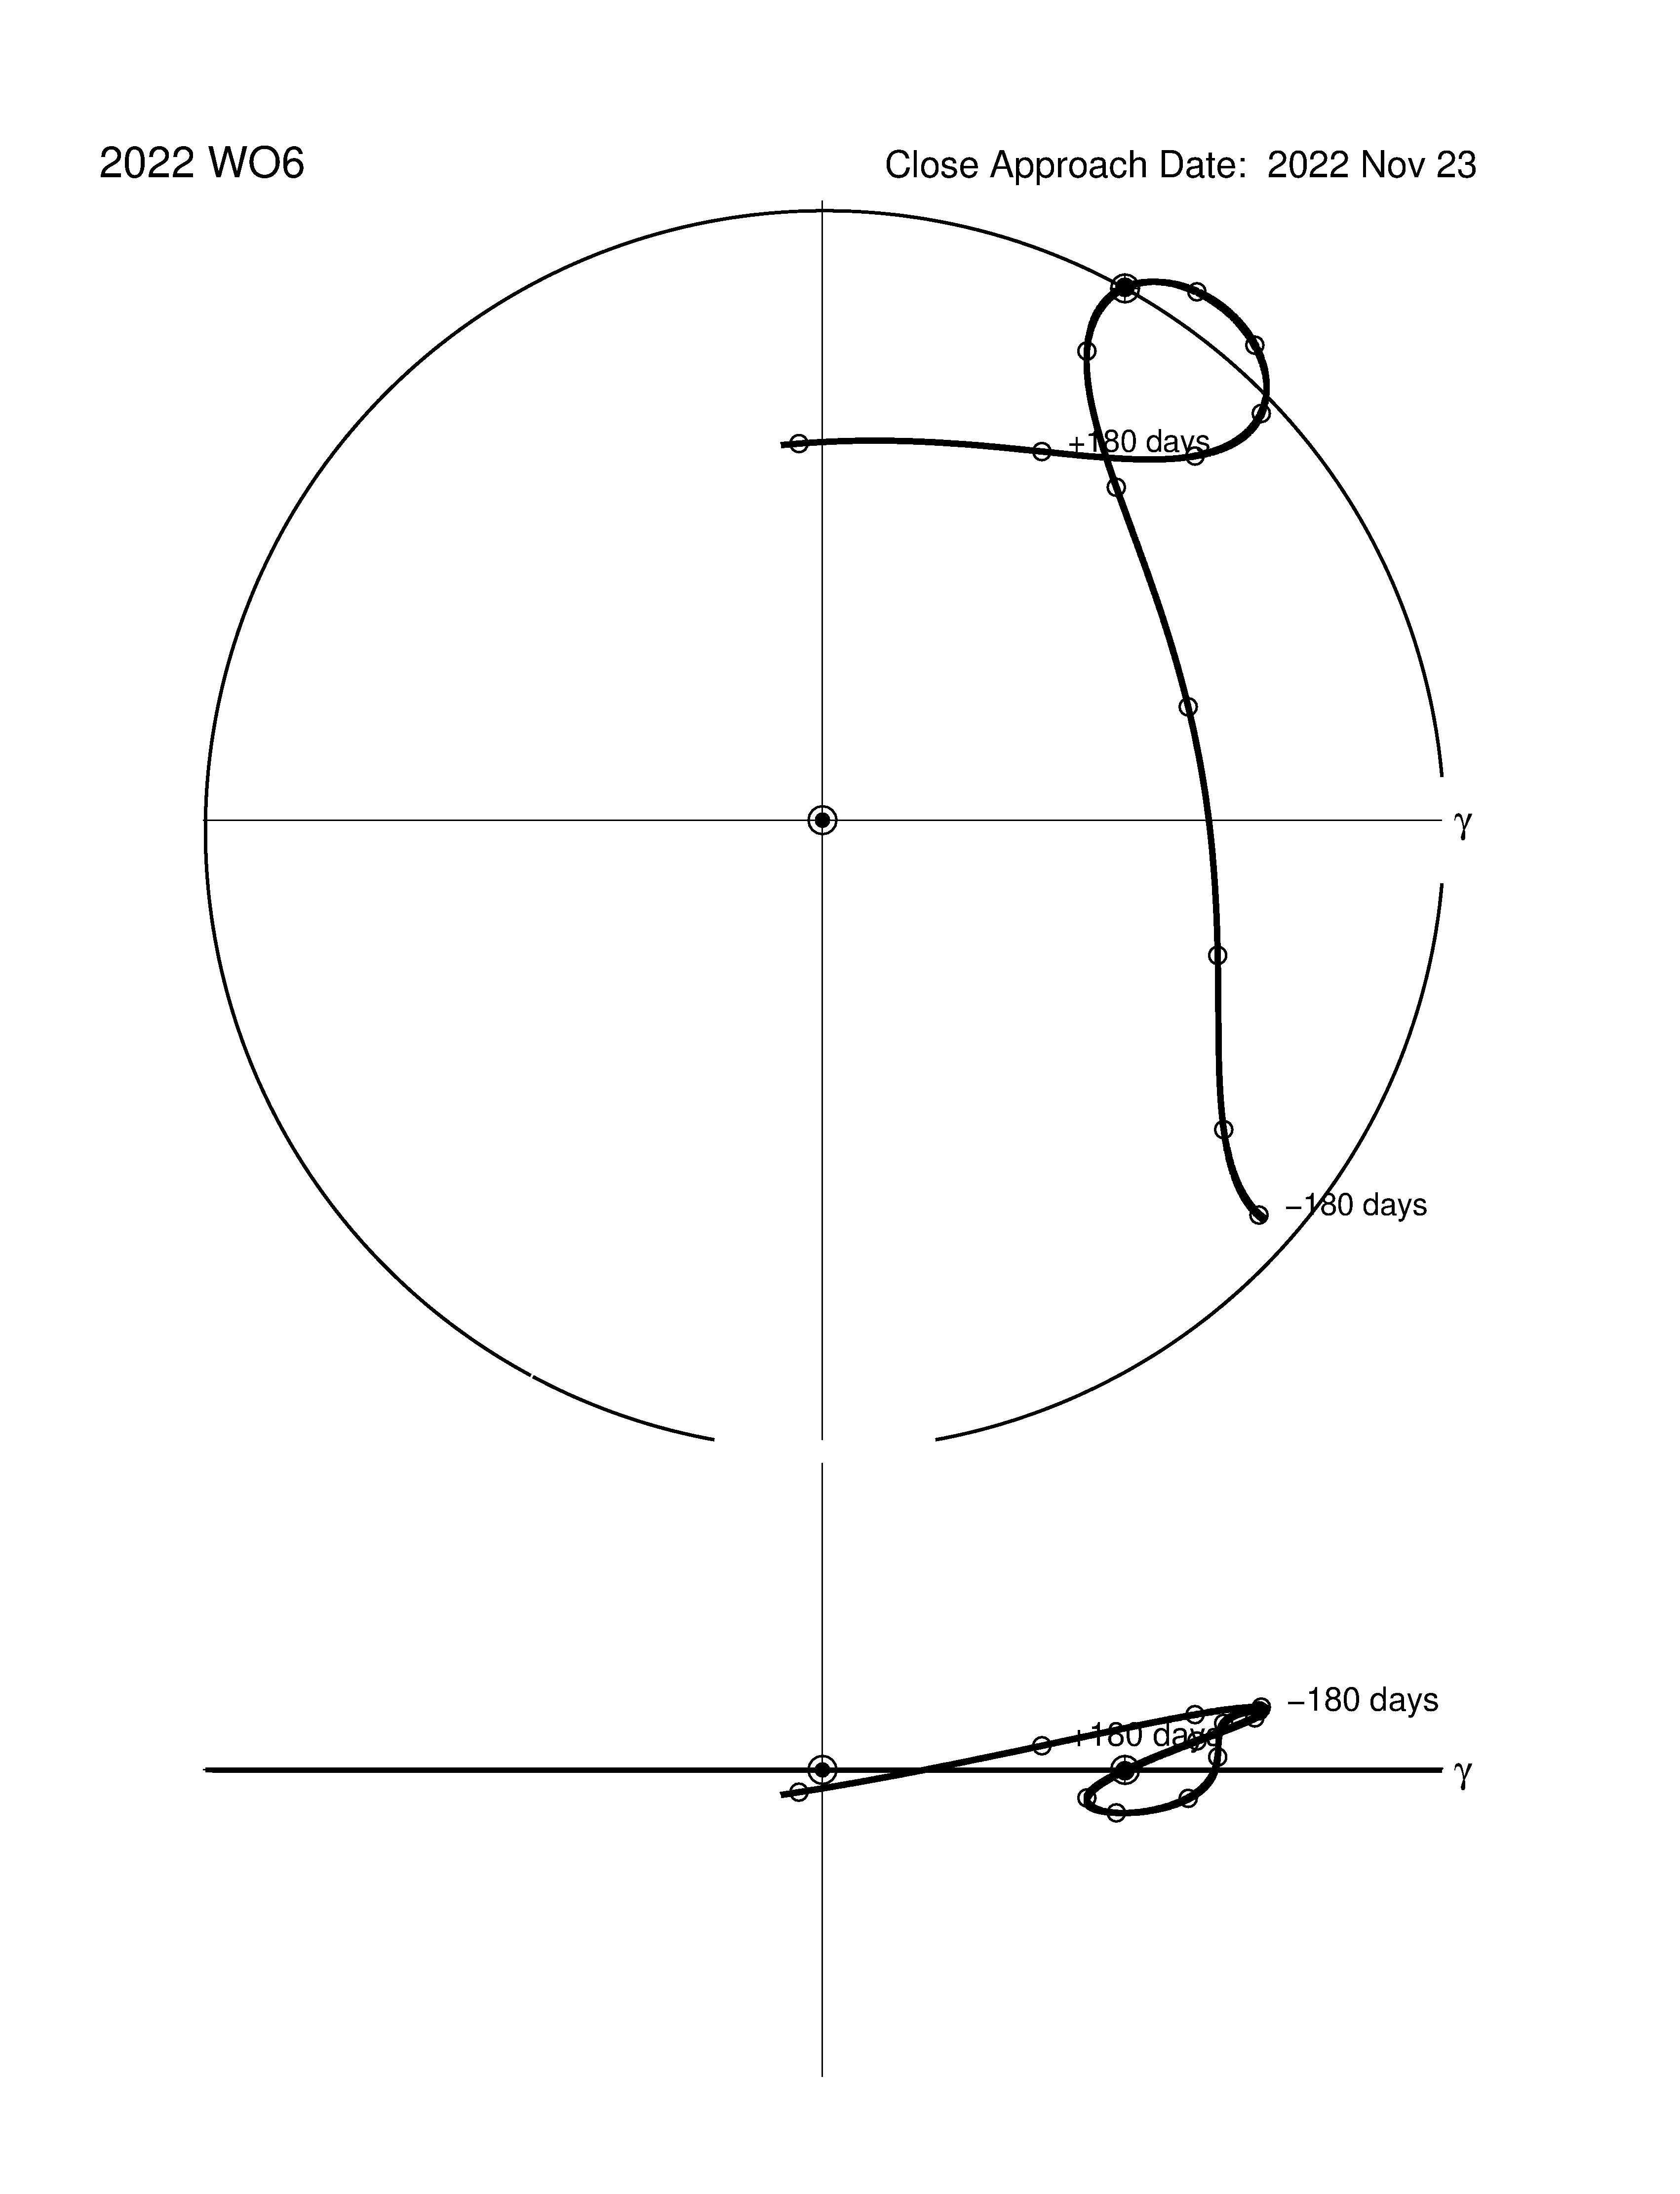
View of the orbit in a reference frame co-rotating with the Earth. Circles denote positions of the asteroid at intervals of 30 days relative to perihelion (filled circle). The upper plot shows the view from above the ecliptic plane and the low plot is the view along the ecliptic plane.